Environmental Engineering Reference
In-Depth Information
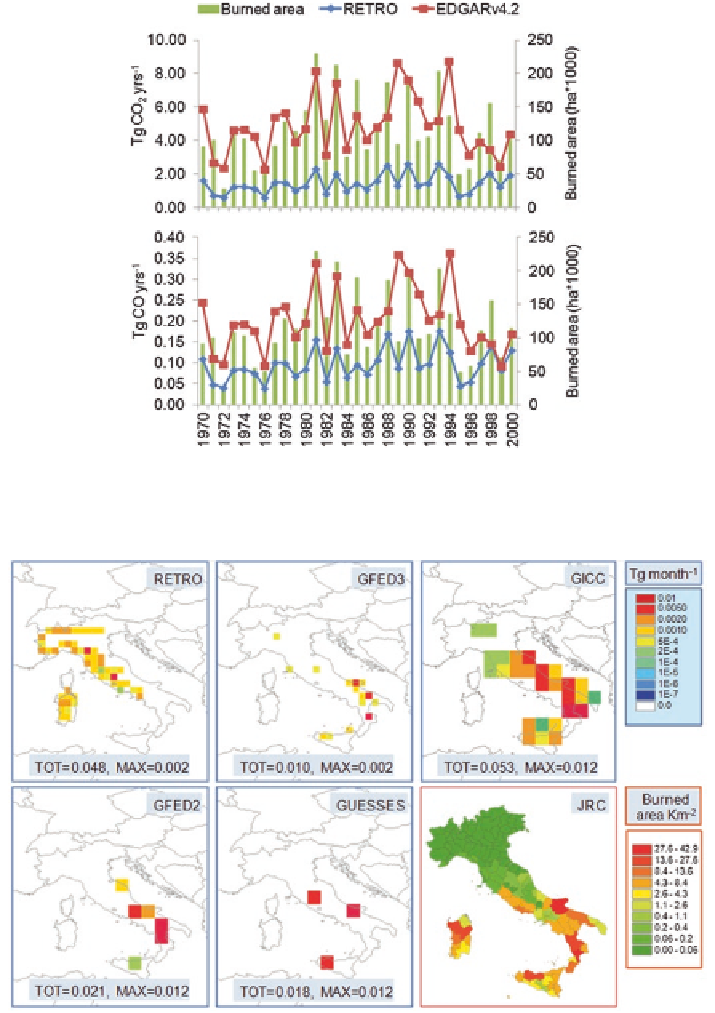
Fig. 6.2
Comparison among annual fire emissions from 1970 to 2000 of CO
2
(
top panel
) and
CO (
bottom panel
) from RETRO and EDGARv4.2 inventories
−
1
) from five inventories at monthly base (RETRO,
GFEDv3, GICC, GFEDv2, GUESS-ES) and NUT03 burned area (km
2
) for July 2000. RETRO
and GFEDv3 are at 0.5° resolution, GICC, GFEDv2, GUESS-ES are at 1° resolution
Fig. 6.3
Maps of CO emissions (Tg month