Geoscience Reference
In-Depth Information
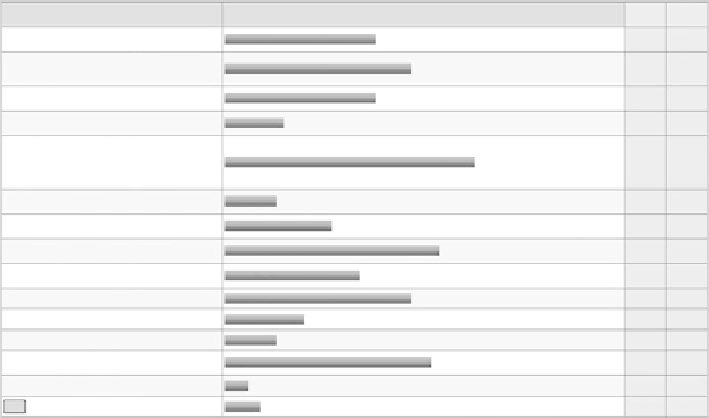
Response
Percent
Response
Total
Soil Data Mart
38.6%
17
(http:// soildatamart.nrcs.usda.gov/)
Natural Resource Conservation
Service Data Gateway
(http://datagateway.nrcs.usda.gov/)
Great Lakes Information Network
(GLIN) (www.great-lakes.net)
Center for Geographic Information
(www.Michigan.gov)
Ohio Department of Natural
47.7%
21
17
38.6%
15.9%
7
Resources (ODNR) Geographic
Information Management
Systems (GIMS)
(www.dnr.state.oh.us/gims/)
63.6%
28
Indiana Geological Survey - A GIS Atlas
(http://129.79.145.7/arcims/statewide_mxd/index.html)
Ohio Link Digital Media Center
(http://dmc.ohiolink.edu/GEO/LS7)
United States Geological Survey
(USGS) (www.usgs.gov)
Lucas County AREIS
(http://www.co.lucas.oh.us/AREIS/areismain.asp)
Individual agency websites
GIS feature data services
Purchase data from vendors
Request data from
agencies/individuals
None of these
Other (please specify)
13.6%
27.3%
6
12
54.5%
24
34.1%
47.7%
20.5%
13.6%
52.3%
6.8%
9.1%
15
21
9
6
23
3
View
4
Fig. 9.4 Spatial data resources
question asked how often they had used the viewer on this site. Many of the
respondents indicated that this was their first time (32.4 %), while never (26.5 %)
was also a popular response. The participants were then led through a series of
question asking about the different data layers they used at various extents. At the
full watershed coverage extent, land use land cover and watershed boundaries layers
were both used by 21 respondents (61.8 %). When asked which watershed sub-unit
they made use of, 16 respondents (47.1 %) had chosen the Lower Maumee, while the
Upper Maumee was chosen by 15 respondents (47.1 %). The least used watersheds
were the St. Joseph's and St. Mary's, which only had 6 respondents (17.6%) utilizing
these areas.
Once the participants accessed one of the watersheds, the map zooms to that section
and other layers appear. They were asked which layers were utilized at this spatial
extent. The most prevalent was the major rivers layer with 21 respondents (61.8 %),
and watershed boundaries and counties each having 18 respondents (52.9 %). The
least chosen data layer was congressional districts with only 2 respondents (5.9 %)
choosing to view this layer. As they zoom in even further to the county/sub-county
level even more layers appear. Again, the most utilized layer was major rivers with 19
respondents (55.9 %). Watershed boundaries and stream network were close behind
with 52.9 % and 50 % of respondents viewing these layers respectively. The least
utilized layers were census blocks, census block groups, census economic, and census
housing, which not one respondent viewed or manipulated these layers.
The next question was open ended and asked if the participants were doing any
kind of statistical analysis that could make use of the data. Of the 24 respondents, 16
said no and 8 said yes mostly without any explanation. Then, the question about
map tools was addressed. Utilizing the zoom in tool (79.4 %) and legend (76.5 %)