Biomedical Engineering Reference
In-Depth Information
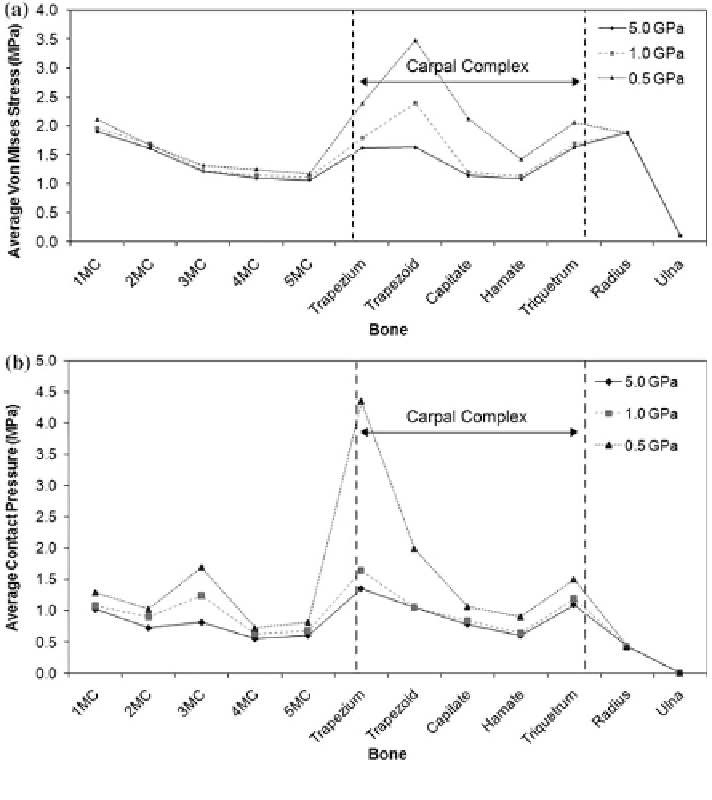
Fig. 6.7
Average stress (a) and contact pressure (b) for three different moduli of the bones graft
6.4.1 Mechanical Stress Distribution Within the Bones
The difference of stress distribution among the three cases was clearly evident in
Fig.
6.4
. A uniform load transmission was found at the carpal complex in the
TWA model with small variations of stress magnitudes ranging from 1.08 to
1.63 MPa (Fig.
6.5
). The corresponding bones in the RA model however showed
high variation of stress magnitudes ranging from 1.87 to 3.97 MPa, thus indicating
a non-uniform load transmission. In comparison with the healthy model, stress
distribution in the TWA model showed no similarity. Among all the three models,
the healthy model have the highest magnitude of stress per element (average
Search WWH ::

Custom Search