Information Technology Reference
In-Depth Information
Fig. 3.
Percentage of variance captured by PCs
faults as described previously, and were used for testing the performance of the
proposed PCA and SVM method.
In the first stage, a PCA monitoring model was produced using the recorded
fault-free data set. First, the number of PCs that can describe the variance
of data was determined. Fig.3 shows the percentage of variance captured by
each PC with a dashed line representing 5% of the variance limit. The variance
captured by some PCs which was less than 5% can be considered as the irrelevant
information. This PCA approach thus compressed the variation incorporated in
the 12 process variables to 5 PCs, which were capable of capturing 97.3% in
average for seven fault groups.
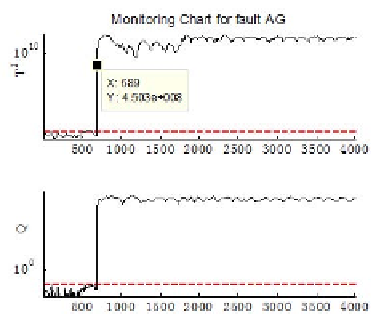
After the PCA model was established, a new data set with a certain kind of
fault was estimated using the model. The confidential control limits for
T
2
and
Q statistics were 95%, and the monitoring chart was plotted in Fig.4.
Fig. 4.
Monitoring chart for faulty signals

Search WWH ::

Custom Search