Information Technology Reference
In-Depth Information
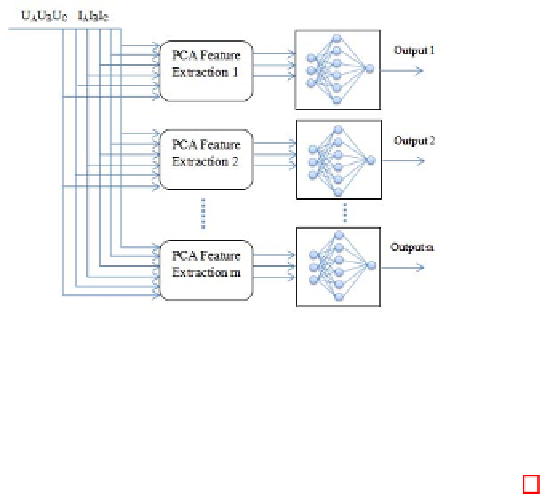
Fig. 2.
Diagram of SVM network with features as input
With these advantages, it is possible to use SVM to process new data with
the data-base to identify the type of fault, such as the phase-to-phase, phase-to-
ground or three phases fault. The classification scheme is shown in Fig.2.
As shown in Fig.2, the signals with multiple variables as the input are prepro-
cessed to generate the uncorrelated and independent eigenvalues by PCA based
on the data collected under different situations. The featured eigenvalues are
then used as the input of the SVM network to classify the faults.
4 Implementation
The proposed method was applied to the fault diagnosis in the power system
transmission line as shown in the following.
4.1 Faults in Transmission Line
The simulation was carried out using SimPowerSystems package in Matlab, which
described a three-phase, 60Hz, 735kV power system transmitting power from a
power plant through 600 km transmission line. The transmission line was split
into two 300km lines connected between three buses. To simulate all the situa-
tions, different type of faults were considered by different combinations of source
impedances. For each condition, the fault simulation was carried out by changing
the parameters in the fault breaker and the data was collected respectively.
4.2 Simulation Results
Two data sets were both recorded from the simulated transmission line corre-
sponding to fault free and faulty conditions. The fault free data set described
normal power transmission behaviour and included a total of 4000 samples. The
faulty condition consisted seven groups of data represented different type of
Search WWH ::

Custom Search