Information Technology Reference
In-Depth Information
e
r
PID
N
Z
P
N
PS
PS
PS
ec
Z
PB
PS
PB
P
PS
PS
PS
Fig. 4.
Fuzzy rules table of the fuzzy inference
N
Z
P
PS
P
1
1
0.5
0.5
0
0
0
0.2
0.4
0.6
0.8
1
-1
-0.5
0
0.5
1
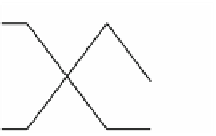
Fig. 5.
The membership functions of inputs and output in the fuzzy inference
T
s
=10 ms. The load current
I
load
varies in a wide range from 20 A to 35 A and
load steps of different magnitudes were applied to the system. The compressor
voltage amplitude was restricted at the range of [0, 80].
From the Figure 6, it is clearly that the load current changes impacts on
λ
O
2
.
When the load current increases, the consumption of oxygen is corresponding
increase, and if the inlet mass of oxygen is constant, the oxygen excess ratio
λ
O
2
will decrease; whereas the
λ
O
2
will correspondingly increase in equal increments
as the consumption of oxygen if the load current decrease with the condition of
inlet oxygen is constant. From the work [15], we know that the output power
of fuel cell is the maximum power output when the
λ
O
2
is near 4. And if the
oxygen excess ratio
λ
O
2
is greater or less than 4, the output power of PEM fuel
cell is not the maximum. Even the starvation phenomenon would occur when the
oxygen excess ratio
λ
O
2
<
1. As can be seen from the simulation, it is necessary
to regulate the oxygen excess ratio at a suitable value.
It can be seen from the Figure 6 and 7 that the oxygen excess ratio is steadily
regulated at the setting value with the load current changed under the action
6
4
2
0
40
30
20
0
2.5
5
7.5
10
12.5
15
17.5
t (s)
Fig. 6.
Oxygen excess ratio curves with load current changed


Search WWH ::

Custom Search