Database Reference
In-Depth Information
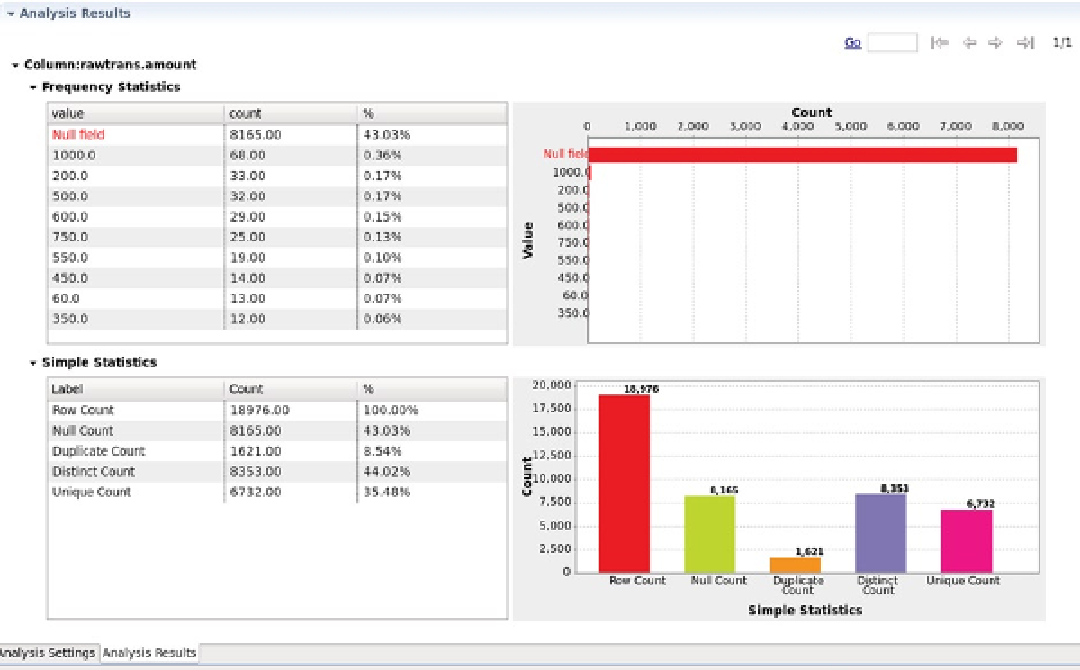
Figure 11-28.
Results for a single-column report
Multi-Column Reports
In the same way that a single-column report is created, multi-column reports can be generated. When I select the
columns on which the report will be drawn, I press the Control key and select “multiple columns.”
The report shown in Figure
11-29
was created from four columns in the trade.rawtrans table: “amount”,
“department” (dept), “supplier”, and “export area” (exparea). The Data mining
Type
parameter tells Talend what type
of data it is examining. For the “amount” column, I set it to Interval because that column contains numeric values;
I set it to Unstructured Text for the other columns, as they are strings. The simple statistics displayed in Figure
11-29
include the column row count and counts for distinct, duplicate, and unique values. Clicking the Run icon then runs
the report and produces the bar graph shown on the right.
Search WWH ::

Custom Search