Database Reference
In-Depth Information
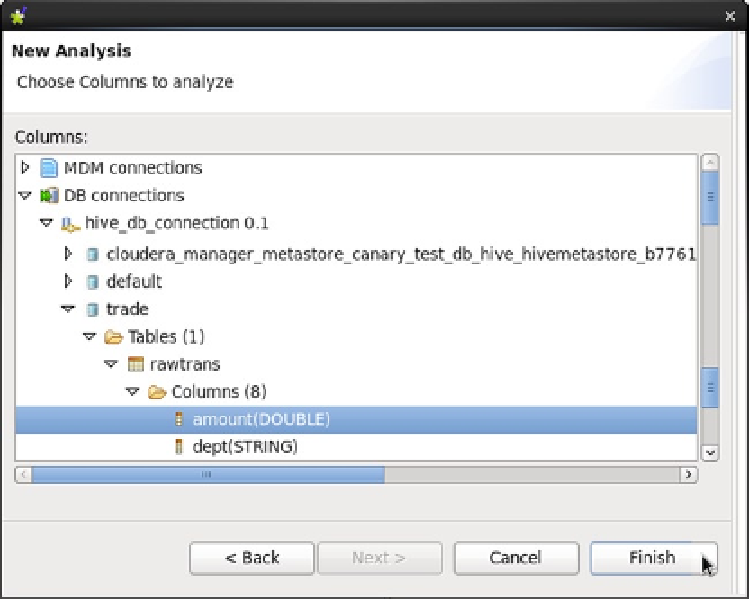
I click Next again to choose the database table column for the report. I expand the Hive DB connection until the
appropriate database table column can be selected, and then I select Finish, as shown in Figure
11-27
.
Figure 11-27.
Choosing the database column
Figure
11-28
shows the Analysis Results tab of a single-column report drawn from the rawtrans “amount”
column. It shows both table and bar graph, with the total and null counts for the column. It also shows the spread of
values as the duplicate, distinct, and unique counts for this column.
Search WWH ::

Custom Search