Environmental Engineering Reference
In-Depth Information
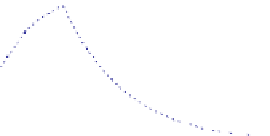
1,20E+07
1,00E+07
8,00E+06
6,00E+06
4,00E+06
2,00E+06
0,00E+00
1
6
11
16
21
26
31
36
41
46
51
56
61
66
71
76
81
Year
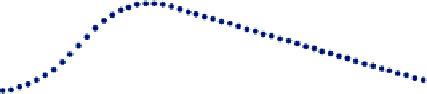
Rapidly biodegradable fractions
Moderately biodegradable fractions
Slowly biodegradable fractions
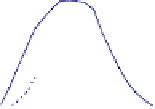
Figure 7. Results of LFG production, for each group of waste components with different biodegradation
velocity, obtained by the application of Triangular model.
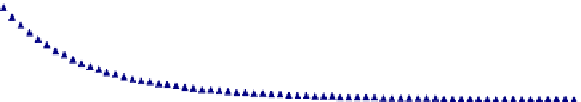
2,50E+07
2,00E+07
1,50E+07
1,00E+07
5,00E+06
0,00E+00
1
6
11
16
21
26
31
36
41
46
51
56
61
66
71
76
81
Year
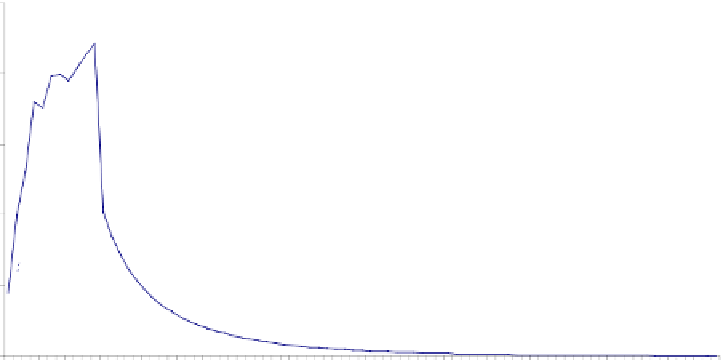
Scholl Canyon
Modified first order
Triangular
LandGEM
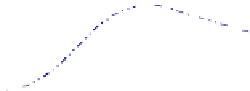
Figure 8. Comparison of results obtained from the different applied models.
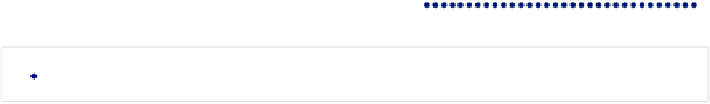
Applying the estimated collection efficiency to the model results, it is possible to estimate
the collected LFG from the model results and compare it with the collected LFG measured
data available for the fifth, sixth and seventh year, as shown in Figure 9.
From a first look at Figure 9, it is evident that the model which fits better the measured
data, at least in the years for which data are available, is the Scholl Canyon one. For these
reasons the selected model is the Scholl Canyon one.