Environmental Engineering Reference
In-Depth Information
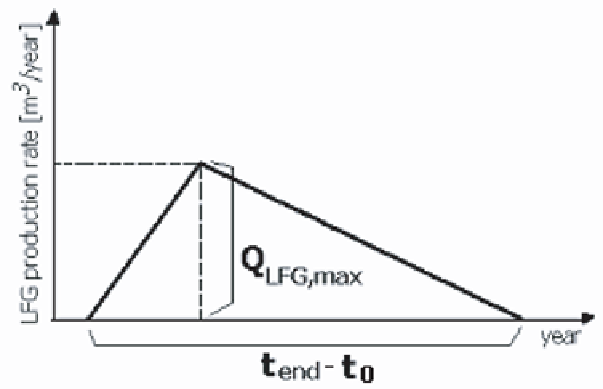
Figure 2. In the original version, LFG production is assumed to start at the end of the first
year of full landfill operation and to finish after a finite time t
end
. The area under the triangle is
equal to one half the base (which represents the time during which LFG production lasts)
times the altitude (which represents the peak rate of LFG production), therefore, the total
amount of LFG produced from an amount R
i
of waste placed in landfill at year i is equal to:
1
(1)
R
L
=
(
t
−
t
)
⋅
Q
i
0
end
,
i
0
,
i
LFG
,
max,
i
2
where:
L
0
= waste potential gas production [m
3
/t]
t
end,i
= time during which gas production takes place [year]
t
0,i
= time at which LFG production starts for waste placed at year i [year]
Q
LFG,i,max
= maximum gas production rate [m
3
/(t · year)]
R
i
= amount of waste placed in landfill at year i [t]
Q
LFG max
s
year
t
- t
end
0
Figure 2. Triangular distribution of LFG production rate.
The triangular model, in the original version (Tchobanoglous et al. 1993), considers two
different behaviours in biodegradation rate, distinguishing waste components in rapidly
biodegradable, which are degraded within five years or less, and slowly biodegradable, which
require up to fifty years for degradation. For each of the two categories a triangular LFG
production distribution is assumed, characterised by a different peak rate time. The total rate
of LFG production from a landfill operated for a given time is obtained graphically - as
shown in Figure 3 - by summing the LFG produced from the rapidly and slowly
biodegradable portions of waste deposited each year.
In the present chapter, as it will be described later, the Triangular model has been applied
considering three different behaviours in biodegradation rate, distinguishing waste
components in rapidly, moderately and slowly biodegradable.