Environmental Engineering Reference
In-Depth Information
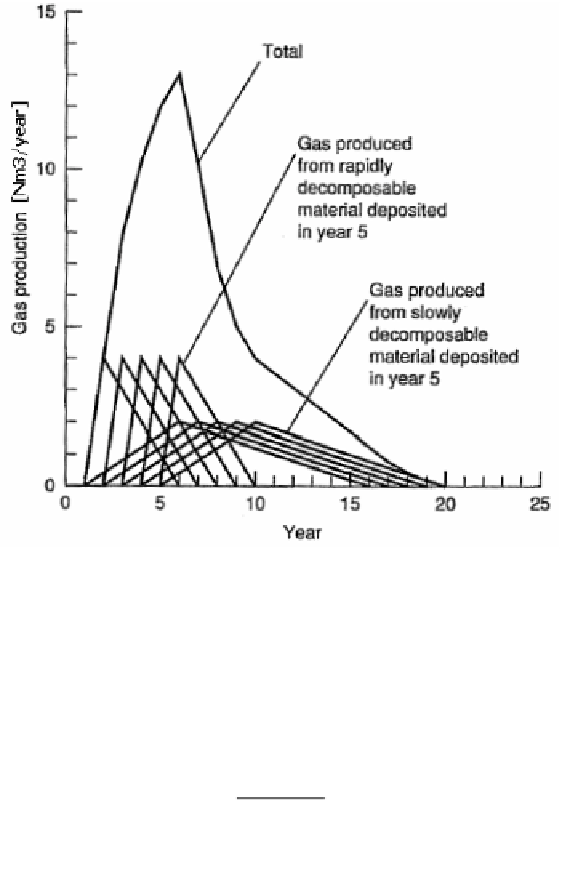
Figure 3.. Graphical representation of LFG production over a five-year period from the rapidly and
slowly decomposable organic materials in landfill (Tchobanoglous et al., 1993).
Analytically, the LFG production rate in the Triangular model can be described as a
function of time as it follows:
Q
=
0
t
≤
t
LFG
,
t
,
i
i
0
,
i
t
−
t
i
0
,
i
growing
phase
:
Q
=
Q
,
t
≤
t
≤
t
LFG
,
t
,
i
LFG
,
max,
i
0
,
i
i
max,
i
t
−
t
max,
i
0
,
i
t
−
t
(2)
max,
i
i
decreasing
phase
:
Q
=
Q
,
t
≤
t
≤
t
LFG
,
t
,
i
LFG
,
max,
i
max,
i
i
end
,
i
t
−
t
end
,
i
max,
i
Q
=
0
t
≥
t
LFG
,
t
,
i
i
end
,
i
where:
Q
LFG,t,i
= LFG production rate at year t for waste placed at year i [m
3
/(t · year)]
t
max,i
= time at which LFG production reaches the peak for waste placed at year i [year]
In order to estimate the current emissions from waste placed in all years, Equation 1 and
Equation 2 can be solved for all values of R
i
and the results summed:
(3)
t
∑
Q
=
Q
LFG
,
t
LFG
,
t
,
i
i
=
initial
year