Environmental Engineering Reference
In-Depth Information
800
600
10A
10B
10C
10 Mean
25A
25B
25C
25 Mean
400
200
0
-200
1/25
1/27
1/29
1/31
2/2
2/4
2/6
2/8
2/10
2/12
Date
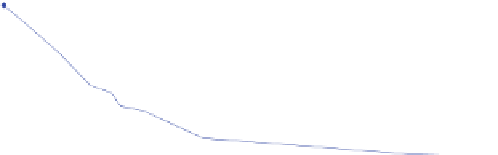
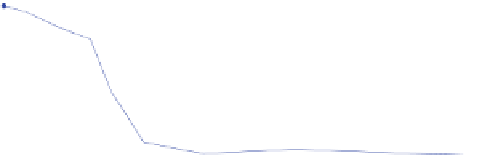
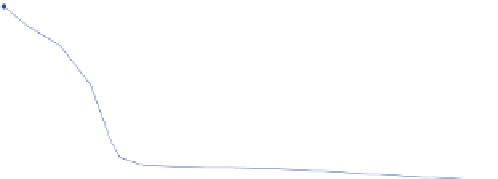
Fig. 7.8 Plotting of Eh measurements as a function of time. Note that replicate Eh measurements
sometimes vary by more than 100 mV
Record your observations (especially at the depths of the electrodes), noting
whether the reaction to
d was negative, or positive, and if positive, indicate
whether you think the reaction was weak, moderate or strong. Document any
reaction to
αα
d at various other places up and down the core to try to obtain a
better sense of where in the soil, Fe
3+
has been reduced to Fe
2+
. If you observe a
positive reaction to
αα
d in the soil core, be careful to document where in the
soil that reaction was observed, especially in relation to where the water table
was located within the soil.
12.
Measuring soil pH
. In order to be able to plot data on an Eh-pH diagram, you
will need to measure the pH of the soil at the same depths where you measured
Eh. Use the OTHER HALF of the core to which you did NOT apply the
αα
d for
measuring pH. Collect a few (10) ml of soil material from each of the two
depths where Eh was measured and make a thick slurry by adding distilled
water and stirring (the goal is the equivalent of 1:1 soil:water, but as you are not
starting with dry soil, this will be an approximation). Allow the slurry to sit for
10-15 min and then mix again. Measure the pH by using a calibrated pH meter
with a combination electrode and record to the nearest 0.1 units.
13.
Data Analysis
. Eh data should be reported in three ways. First, these data
should be plotted as a function of time. This will allow you do evaluate whether
any of the readings from any of the electrodes was spurious. Normally, a given
electrode will show trends over time, and not provide erratic readings. If all the
readings for a given electrode follow a trend and then one reading is way off,
there is a good chance that the one reading is faulty. An example of Eh data
plotted in this way is shown in Fig.
7.8
.
The second way in which the mesocosm data should be evaluated is with
regard to an Eh-pH stability diagram. This is to determine whether the soil
conditions were (theoretically) reducing with respect to Fe at any time during
the experiment. You will only have pH measurements from your mesocosm at
beginning and end of the experiment, and the pH is not be expected to change
dramatically over the course of a couple of weeks (often one unit or less). For
the sake of simplification, we will make the assumption that the pH changed
αα