Environmental Engineering Reference
In-Depth Information
700
500
300
100
-100
10A
10B
10C
10 M
25A
25B
25C
25M
TS
Goethite
-300
3
4
5
6
7
pH
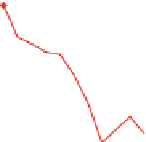
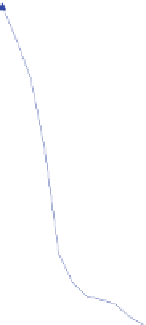
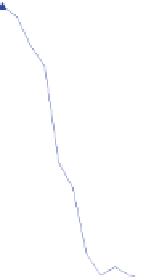
Fig. 7.9 Example data from mesocosms plotted on an Eh-pH diagram. Also shown is the
“technical standard” line (TS) from the National Technical Committee for Hydric Soils which
they use to define reducing soil conditions and also the stability line for goethite-Fe
2+
gradually (linearly) through the period of the experiment and thus use
interpolated data for the dates in between. When plotted, these data may look
something like those in Fig.
7.9
. Also shown in Fig.
7.9
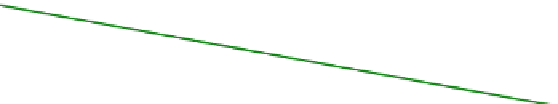
is the line for the
equation Eh
¼
(60 pH). This is the equation from the technical standard
of the NTCHS (sometimes referred to as the “Technical Standard” line)
(National Technical Committee for Hydric Soils
2007
). This is an empirically
derived line (shown in green), and data that plot above this line are considered
to be oxidizing and those below the line indicate reducing conditions. The
Eh-pH line showing the stability field for the crystalline iron oxide mineral
goethite is also shown on the diagram (brown). Some people prefer to discuss
iron reduction and Eh-pH data with respect to predictions using thermodynam-
ically based equations such as this one. Above the line, goethite would be
predicted to be stable and below the line, it would be predicted to unstable with
Fe
3+
being reduced to Fe
2+
.
A third, and perhaps even more useful way to view the data is to plot the data
over time, with the Eh values relative to the TS line (or this could also be done
with respect to the a line like the goethite line). This is done by using pH data (for
each date and depth) to calculate the corresponding Eh along the TS line, using the
equation Eh
595
(60 pH). For example, if the pH ranged from 4.1 to 5.1
over a 6 day period, we would calculate the corresponding Eh values as shown
in Table
7.5
(these change from 349 to 289 as the pH changes from 4.1 to 5.1).
¼
595