Environmental Engineering Reference
In-Depth Information
=
∑
≠
n
[]
j
=
1
−
j
i
E
I
(14.6)
i
n
1
[]
[]
[
2
2
I
=
E
I
−
E
I
(14.7)
i
i
i
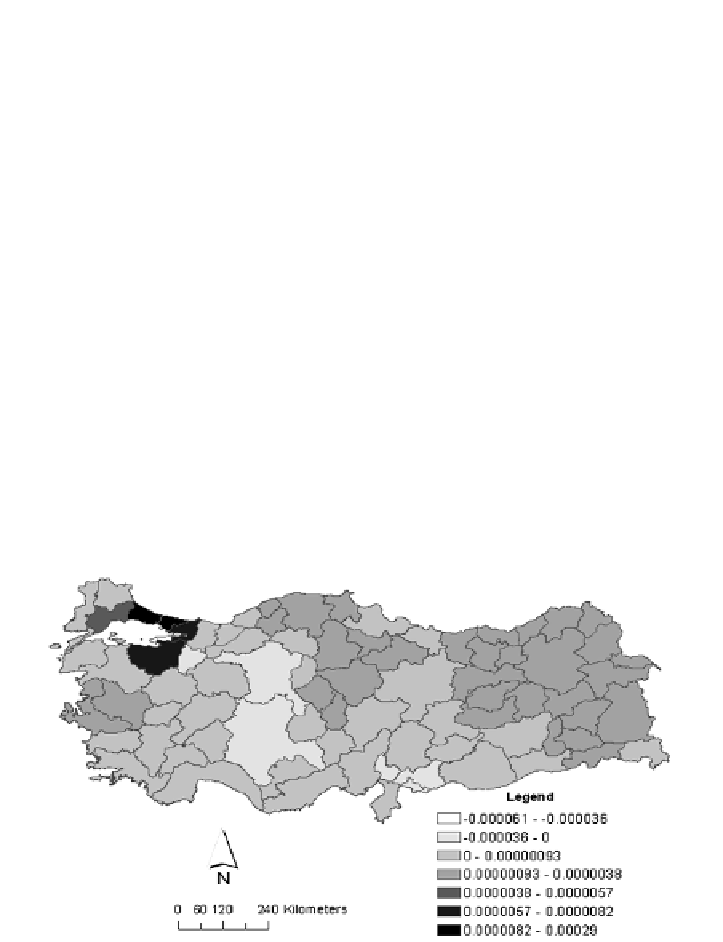
This analysis is performed using the Spatial Statistics Tool in ArcMap 9.3.
Figure
14.10
shows the positive and negative autocorrelation for the provinces and their
neighbours with respect to the amount of electricity consumed. The darkest col-
ours represent a higher positive autocorrelation between a province and its
neighbours and vice-versa.
Figure 14.10
shows four positive autocorrelation clusters. The most obvious of
these clusters is in the northwest part of the country, including Istanbul. This is
followed by a cluster on the west coast around Izmir. These provinces are charac-
terised by a developed industrial sector and high population densities. Therefore,
the positive autocorrelation in these clusters means higher electricity consumption
in the provinces and their neighbouring provinces. This is also concluded in previ-
ous analyses (see
Figure 14.9
). In fact, the other two positively autocorrelated
clusters that are located in the northern and north-eastern part of the country are
observed due to low electricity consumption in these provinces and their
neighbours.
Fig. 14.10.
Anselin Local Moran's I analysis for electricity consumption in 2006
In contrast, two clusters with negative autocorrelation values (the lighter coloured
groups) are observed, one around the central part of the country, including An-
kara, and one around the southeast portion of the country, around Osmaniye and
Gaziantep, as a result of higher electricity consumption in these province clusters
than their neighbouring provinces. For instance, since Ankara, seen in the central
part of the country, has higher electricity consumption than its neighbouring prov-
Search WWH ::

Custom Search