Information Technology Reference
In-Depth Information
this is a noticeable 19 percent increase from one day to another. We should
customize the report and add a success metric, such as Revenue, to investigate further.
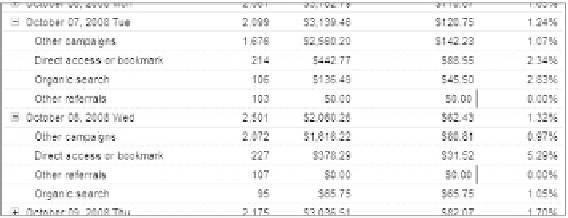
figure 8.2 shows a visit report with a Revenue column added.
Figure 8.2
Customized visit report; we added the Revenue metric.
customizing the report quickly turns the initial “woohoo” moment into a
“boohoo” moment. You can see that the days before and after the traffic increase are
averaging about $3,000 in revenue, but on the day of the 19 percent visit increase, we
are only at $2,000.
october 7: 2,099 visits, $3,139.46 revenue
october 8: 2,502 visits, $2,060.26 revenue
197
this indicates not just a 35 percent revenue decrease; it is a 35 percent revenue
decrease coupled with a 19 percent increase in traffic. to get a better understanding
of what the heck happened, i suggest drilling into the money part first, adding in the
average order Value and the Visit to sale conversion Rate, as shown in figure 8.3.
Figure 8.3
Adding in multiple revenue-related metrics
Doing so quickly shows us that we do indeed convert visits to sales at much the
same rate, but for some reason the average order value tanked to about half of what it
used to be. Your next step is to investigate the traffic sources, zeroing in on a potential
bad source. You again use the custom Report Wizard, but this change is about adding
not
another metric but another dimension—traffic sources. You then expand the tree
on the result report, as shown in figure 8.4.
Figure 8.4
Adding multiple revenue-related metrics and a traffic source dimension