Information Technology Reference
In-Depth Information
now it is quite visible that the negative impact on the average order value was
caused by campaign activity, also called other campaigns. aha! that's where the
money was wasted. now you should move on to your campaign reporting for
october 8 or perhaps even just add in a third campaign dimension to this report
to get more details.
this approach works on other primary dimensions such as Visitors, first or
Returning Visitors, and so on. the success metric does not have to be Revenue—it
could be any other metric you defined as one of your Kpis.
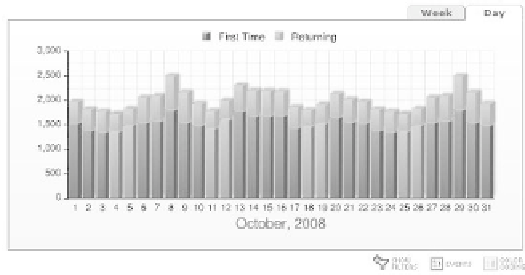
moving on, but still within the visit sphere, i would like to showcase two other
reports that help you gain insight with very little work on your part. the first one is
the first-time versus returning visitors report, shown in figure 8.5.
198
Figure 8.5
First-time versus returning visitors report
this report shows you, to some extent, how loyal your users are and, indirectly,
how valuable your traffic sources are. i am sure we agree that you are keen to have
people make return visits to your web property (unless you are running the technical
support part of your website, where i assume you would rather people never had to
visit in the first place).
think up a number of segments, or just simply use the filters on the report itself
and apply them to learn something about the quality of different visitor segments. an
example is to look into the quality of different keywords, such as “bosch power tools”
versus “power tools.”
comparing figures 8.6 and 8.7, you can see that there is little difference in the
returning visitor rate among a branded product-specific search phrase and a generic
product-specific search phrase.