Global Positioning System Reference
In-Depth Information
is taken, the parameters
f
D
, ˆ
τ
are taken. Such values must belong to the pull-in range of the
tracking stage of the receiver.
2.3.1 Statistical characterization of the detection process
As previously remarked, the signal acquisition can be seen as a statistical process, and the
value taken by the correlator output for each bin of the search space can be modeled as
a random variable both when the peak is absent (i.e.
H
0
) or present (i.e.
H
1
). In each
case the random variable is characterized by a probability density function (pdf). Fig. 3(a)
shows the signal trial hypothesis test decision when both pdfs are drawn.
The threshold
1
3UREDELOLW\RI)DOVH$ODUP
VKDGHGDUHD
3UREDELOLW\RI0LVV'HWHFWLRQ
VKDGHGDUHD
0.9
0.8
0.7
0.6
7KUHVKROG
9
7KUHVKROG
9
0.5
3UREDELOLW\RI&RUUHFW'LVPLVVDO
VKDGHGDUHD
3UREDELOLW\RI'HWHFWLRQ
VKDGHGDUHD
0.4
0.3
0.2
0.1
7KUHVKROG
9
7KUHVKROG
9
0
SGIRIQRLVHRQO\LHSGIRID
+
FHOO
SGIRIQRLVHZLWKVLJQDOSUHVHQWLHSGIRID
+
FHOO
0.02
0.04
0.06
0.08
0.1
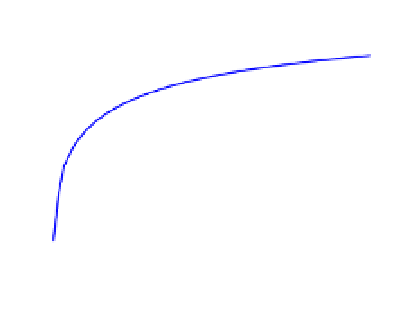
False alarm probability P
fa
(a)
(b)
Fig. 3. (a) Possible pdfs of a hypothesis test; (b) Receive Operating Characteristic (ROC) curve
V
is pre-determined based on the requ
ire
ments
o
f:
(i) false-alarm probability (
P
fa
), e.g.
10
−
3
, or (ii) mean acquisition time (
T
A
), e.g.
T
A
is minimum.
For a specific value of
V
, there are four possible outcomes as shown in Fig. 3(a). Each outcome
is associated with a probability which can be computed by an appropriate integration as
(Kaplan, 2005):
•
=
P
fa
Probability of false-alarm (
P
fa
):
+∞
P
fa
=
(
|
)
f
s
H
0
ds
(10)
V
•
Probability of correct dismissal (
P
cd
):
P
cd
=
−
1
P
fa
(11)
•
Probability of detection (
P
d
):
+
∞
P
d
=
f
(
s
|
H
1
)
ds
(12)
V
•
Probability of miss-detection (
P
md
):
P
md
=
−
1
P
d
(13)


Search WWH ::

Custom Search