Graphics Reference
In-Depth Information
Solution
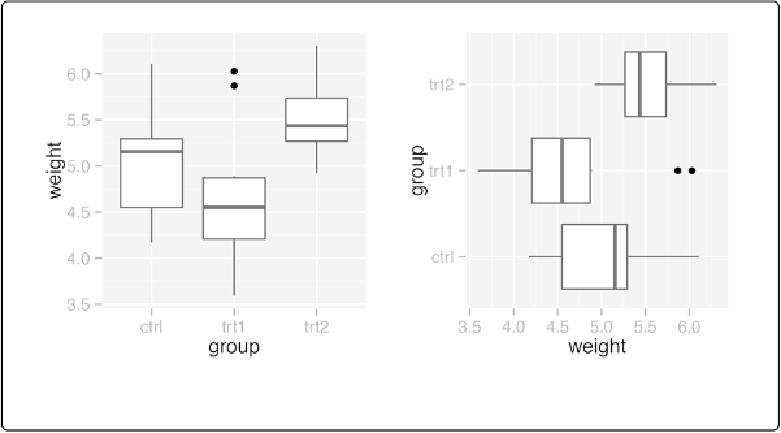
ggplot(PlantGrowth, aes(x
=
group, y
=
weight))
+
geom_boxplot()
ggplot(PlantGrowth, aes(x
=
group, y
=
weight))
+
geom_boxplot()
+
coord_flip()
Figure 8-1. Left: a box plot with regular axes; right: with swapped axes
Discussion
For a scatter plot, it is trivial to change what goes on the vertical axis and what goes on the hori-
zontal axis: just exchange the variables mapped to
x
and
y
. But not all the geoms in ggplot2 treat
the x- and y-axes equally. For example, box plots summarize the data along the y-axis, the lines
in line graphs move in only one direction along the x-axis, error bars have a single xvalue and a
range of yvalues, and so on. If you're using these geoms and want them to behave as though the
axes are swapped,
coord_flip()
is what you need.
Sometimes when the axes are swapped, the order of items will be the reverse of what you want.
On a graph with standard x- and y-axes, the xitems start at the left and go to the right, which cor-
responds to the normal way of reading, from left to right. When you swap the axes, the items still
go from the origin outward, which in this case will be from bottom to top—but this conflicts with
the normal way of reading, from top to bottom. Sometimes this is a problem, and sometimes it