Graphics Reference
In-Depth Information
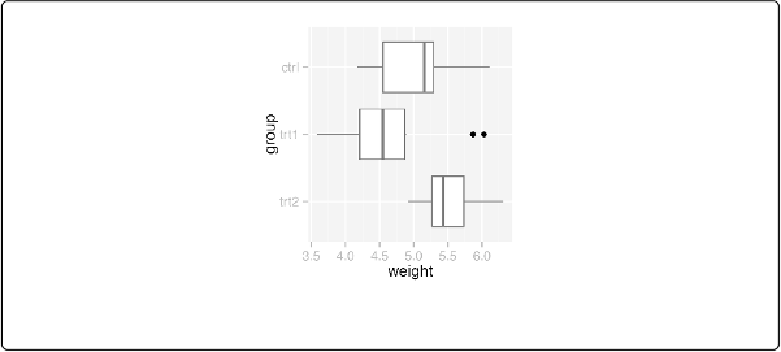
isn't. If the xvariable is a factor, the order can be reversed by using
scale_x_discrete()
with
limits=rev(levels(...))
, as in
Figure 8-2
:
ggplot(PlantGrowth, aes(x
=
group, y
=
weight))
+
geom_boxplot()
+
coord_flip()
+
scale_x_discrete(limits
=
rev(levels(PlantGrowth$group)))
Figure 8-2. A box plot with swapped axes and x-axis order reversed
See Also
If the variable is continuous, see
Reversing a Continuous Axis
to reverse the direction.
Setting the Range of a Continuous Axis
Problem
You want to set the range (or limits) of an axis.
Solution
You can use
xlim()
or
ylim()
to set the minimum and maximum values of a continuous axis.
Figure 8-3
shows one graph with the default ylimits, and one with manually set ylimits:
p
<-
ggplot(PlantGrowth, aes(x
=
group, y
=
weight))
+
geom_boxplot()
# Display the basic graph
p
p
+
ylim(
0
, max(PlantGrowth$weight))