Biomedical Engineering Reference
In-Depth Information
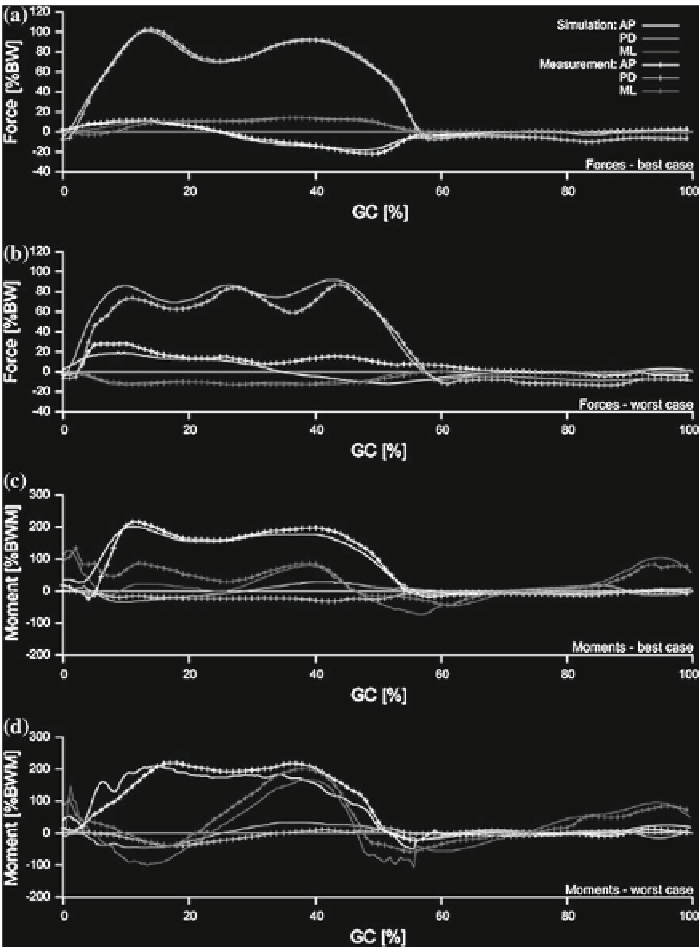
Fig. 7.3
Best and worst case scenario of forces and moments based on lowest and highest RMSD:
simulation-data is represented by plain lines, measurement data by lines with asterisks. AP-direction
is represented by black, PD-direction by gray and ML-direction by light gray shade.
a
best case of
forces (trial DR05, RMSD = 1.6%BW),
b
worst case of forces (trial MS20, RMSD = 12.2%BW),
c
best case of moments (trial SK07, RMSD = 18.9%BWM) and
d
worst case of moments (trial
VE13, RMSD = 35.6%BWM). Reproduced with permission from Fig.
7.1
in Schwarze et al. [
3
]