Biomedical Engineering Reference
In-Depth Information
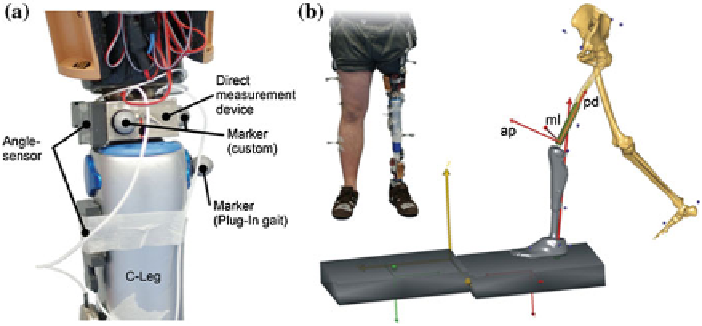
Fig. 7.2 a
Detailed view of the transducer location and its integration between socket and exopros-
thesis.
b
Lower extremity of one of the subjects and corresponding multi-body model during gait
with the transducer location marked by the coordinate system, where loads are determined. Position
and orientation of the DOF joint above the implant, determining loads
Vicon MX-20/MX-40, PlugIn-Gait marker set lower extremity) and two force plates
(AMTI, USA).
Forces and moments at the socket-prosthesis interface (Fig.
7.2
a) were synchro-
nously measured with motion capture data during all trials using a six-axis force-
moment sensor (FMS). A minimum of six valid walking trials at self-selected speed
was collected per subject.
A lower extremity MBS model was generated using the AnyBody environment
(Version 4.2, AnyBodyTech A/S, Aalborg-Denmark). Individual models were gen-
erated by scaling according to the parameters height, body mass and leg length of
each participating subject. The socket worn by the subjects was regarded as being
rigidly connected to the remaining stump. In order to calculate forces and moments
at the location of the FMS, a zero degree of freedom joint located above the knee joint
of the amputated thigh segment was introduced. The contribution of muscle-force
was neglected, as there are no muscles present which span the knee-prosthesis or the
interface of the socket to the prosthesis.
Comparison of measured and simulation data were performed using the follow-
ing characteristic gait cycles parameters: anteroposterior force (FAP), mediolateral
force (FML), proximal-distal force (FPD), anteroposterior moment (MAP), medio-
lateral moment (MML) and proximal-distal moment (MPD). Calculated and mea-
sured forces in all six subjects revealed very closely matched time dependent values
in the best, and good agreement in the worst case observed (Fig.
7.3
). The amount
of difference varied from subject to subject, but showed good coherence within the
set of trials of a single subject. Differences in force reach a maximum of 8%BW at
only few time-steps in the best (subject DR, Fig.
7.3
a) and more than 20%BW over
around 20% of the gait cycle in the worst case (subject MS, Fig.
7.3
b).