Game Development Reference
In-Depth Information
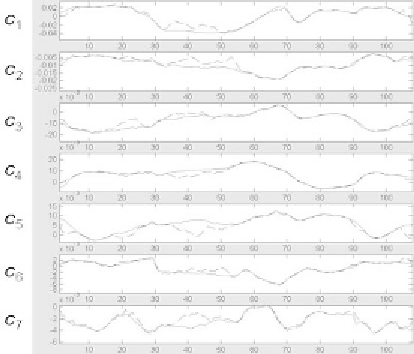
Figure 10. Compare the estimated MUPs with the original MUPs. The
content of the corresponding speech track is “A bird flew on lighthearted
wing.”
magnitude of the MUPs. The solid red trajectory is the original MUPs, and the
dashed blue trajectory is the estimation results.
We reconstruct the facial deformation using the estimated MUPs. For both the
ground truth and the estimated results, we divide the deformation of each marker
by its maximum absolute displacement in the ground truth data. To evaluate the
performance, we calculate the Pearson product-moment correlation coefficients
(
R
) and the mean square error (MSE) using the normalized deformations. The
Pearson product-moment correlation (
≤
R
) measures how good the
global match is between the shapes of two signal sequences. A large coefficient
means a good match. The Pearson product-moment correlation coefficient R
0
0
≤
1
0
d
d
between the ground truth {
} and the estimated data {
'
} is calculated by
n
n
tr
(
E
[(
d
−
µ
)(
d
'
−
µ
)
T
])
R
=
n
1
n
2
(4)
tr
E
d
−
µ
d
−
µ
T
tr
E
d
−
µ
d
−
µ
T
(
[(
)(
)
])
(
[(
'
)(
'
)
])
n
1
n
1
n
2
n
2
E
E
. In our experiment,
R
= 0.952 and MSE =
0.0069 for training data and
R
= 0.946 and MSE = 0.0075 for testing data.
where
µ
=
[
]
and
µ
=
[
'
]
1
n
2
n

Search WWH ::

Custom Search