Database Reference
In-Depth Information
methods that are tailored specifically for handling equally time spaced data series.
For example, the
plot()
function does not require an explicitly specified variable
for the x-axis.
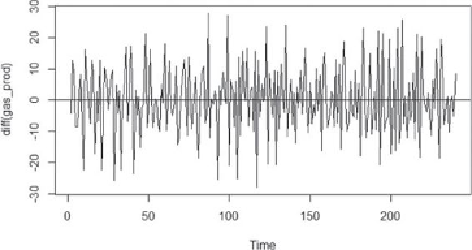
To apply an ARMA model, the dataset needs to be a stationary time series. Using
the
diff()
function, the gasoline production time series is differenced once and
plotted in
Figure 8.12
.
plot(diff(gas_prod))
abline(a=0, b=0)
Figure 8.12
Differenced gasoline production time series
The differenced time series has a constant mean near zero with a fairly constant
variance over time. Thus, a stationary time series has been obtained. Using the
following R code, the ACF and PACF plots for the differenced series are provided
in
Figures 8.13
and
8.14
,
respectively.
# examine ACF and PACF of differenced series
acf(diff(gas_prod), xaxp = c(0, 48, 4), lag.max=48, main="")
pacf(diff(gas_prod), xaxp = c(0, 48, 4), lag.max=48,
main="")