Database Reference
In-Depth Information
The next section presents a seasonal ARIMA example and describes several
techniques and approaches to identify the appropriate model and forecast the
future.
8.2.5 Building and Evaluating an ARIMA Model
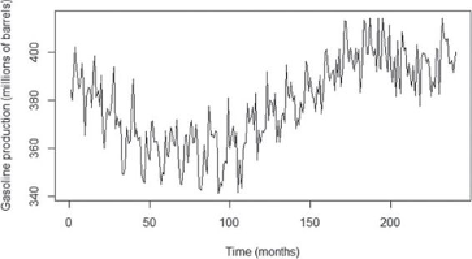
For a large country, the monthly gasoline production measured in millions of
barrels has been obtained for the past 240 months (20 years). A market research
firm requires some short-term gasoline production forecasts to assess the
petroleum industry's ability to deliver future gasoline supplies and the effect on
gasoline prices.
library(forecast)
# read in gasoline production time series
# monthly gas production expressed in millions of barrels
gas_prod_input <- as.data.frame( read.csv("c:/data/
gas_prod.csv") )
# create a time series object
gas_prod <- ts(gas_prod_input[,2])
#examine the time series
plot(gas_prod, xlab = "Time (months)",
ylab = "Gasoline production (millions of barrels)")
Using R, the dataset is plotted in
Figure 8.11
.
Figure 8.11
Monthly gasoline production
In R, the
ts()
function creates a time series object from a vector or a matrix.
The use of time series objects in R simplifies the analysis by providing several