Agriculture Reference
In-Depth Information
1.0
1
2
3
4
5
6
7
8
9
10
11
12
13
14
15
16
17
18
19
20
21
22
23
24
25
26
27
28
29
30
31
32
33
34
35
36
37
38
39
40
41
42
43
44
45
46
.08
#12
.06
#4
0.4
#3
0.2
0.0
0.2
60.
80.
100.
120.
140.
160.
180.
200.
A
Julian date
[66],
Integrated from 3/21 - 6/23/78
57.5
^
18.16
0.04
X
r
2
0.79
Line
——
*
165
——
Long
* PgEn
52.5
47.5
42.5
37.5
[66],
32.5
480
560
640
720
800
880
960
1040
B
Total above ground dry biomass (g/m
2
)
Integrated from 3/21 - 6/23/78
^
14.176
0.111
X
r
2
55.0
0.64
47.5
40.0
32.5
220
250
280
310
340
370
400
C
Grain yield (g/m
2
)
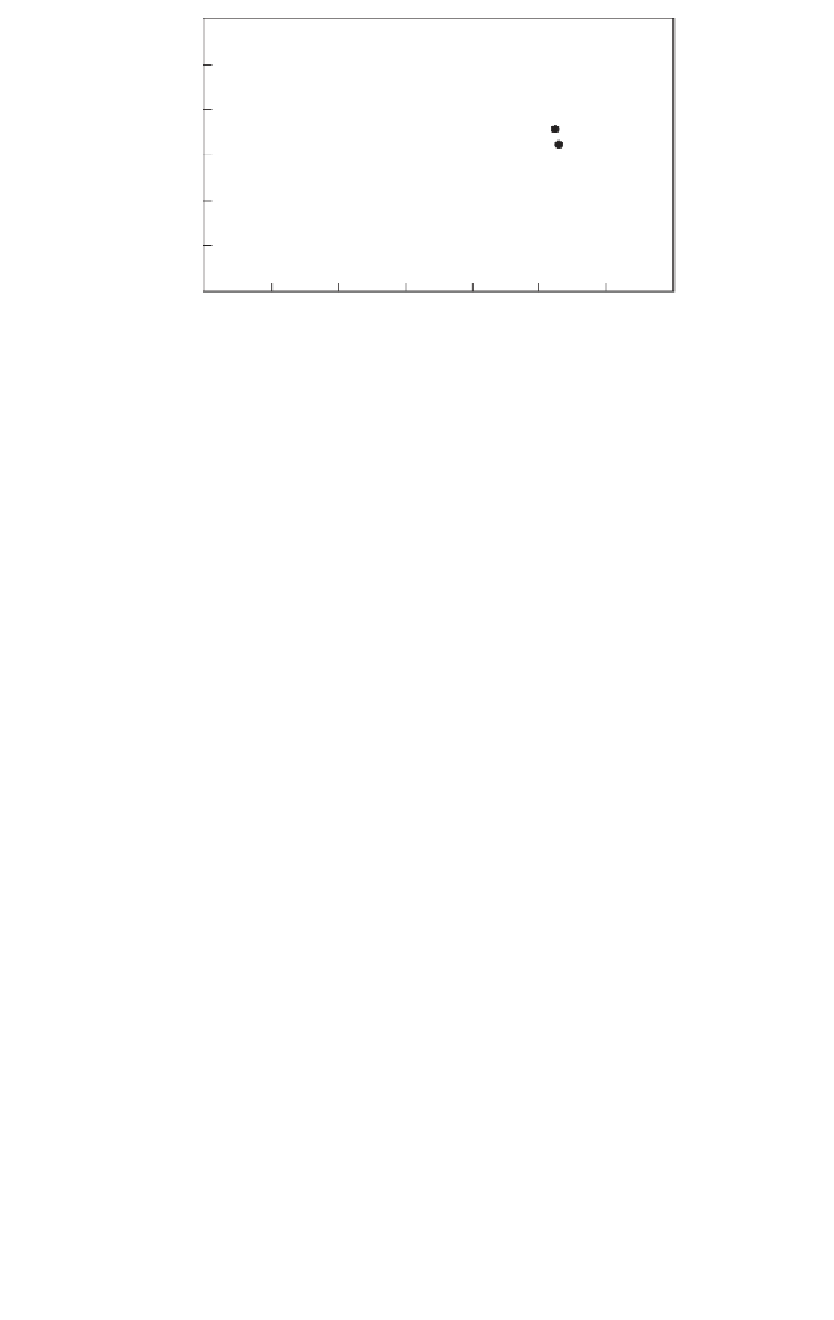
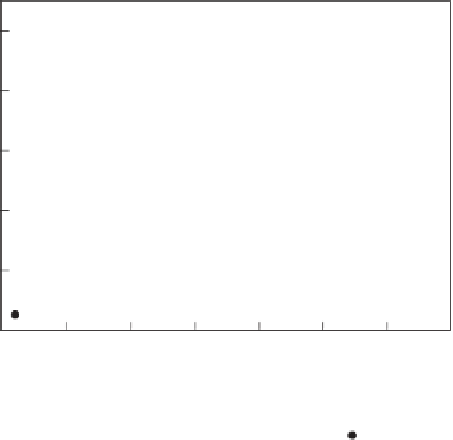
Fig
ure 5.5
(A) Temporal evolution of NDVI (normalized difference vegetation index) of
wheat during the growing season. (B) The relationship between NDVI and total above-ground
dry matter accumulation. (C) The relationship between wheat yield and NDVI during the
growing season (from Tucker et al., 1980, 1981).


Search WWH ::

Custom Search