Agriculture Reference
In-Depth Information
1
2
3
4
5
6
7
8
9
10
11
12
13
14
15
16
17
18
19
20
21
22
23
24
25
26
27
28
29
30
31
32
33
34
35
36
37
38
39
40
41
42
43
44
45
46
[67],
Line
——
0.0
——
Long
PgEn
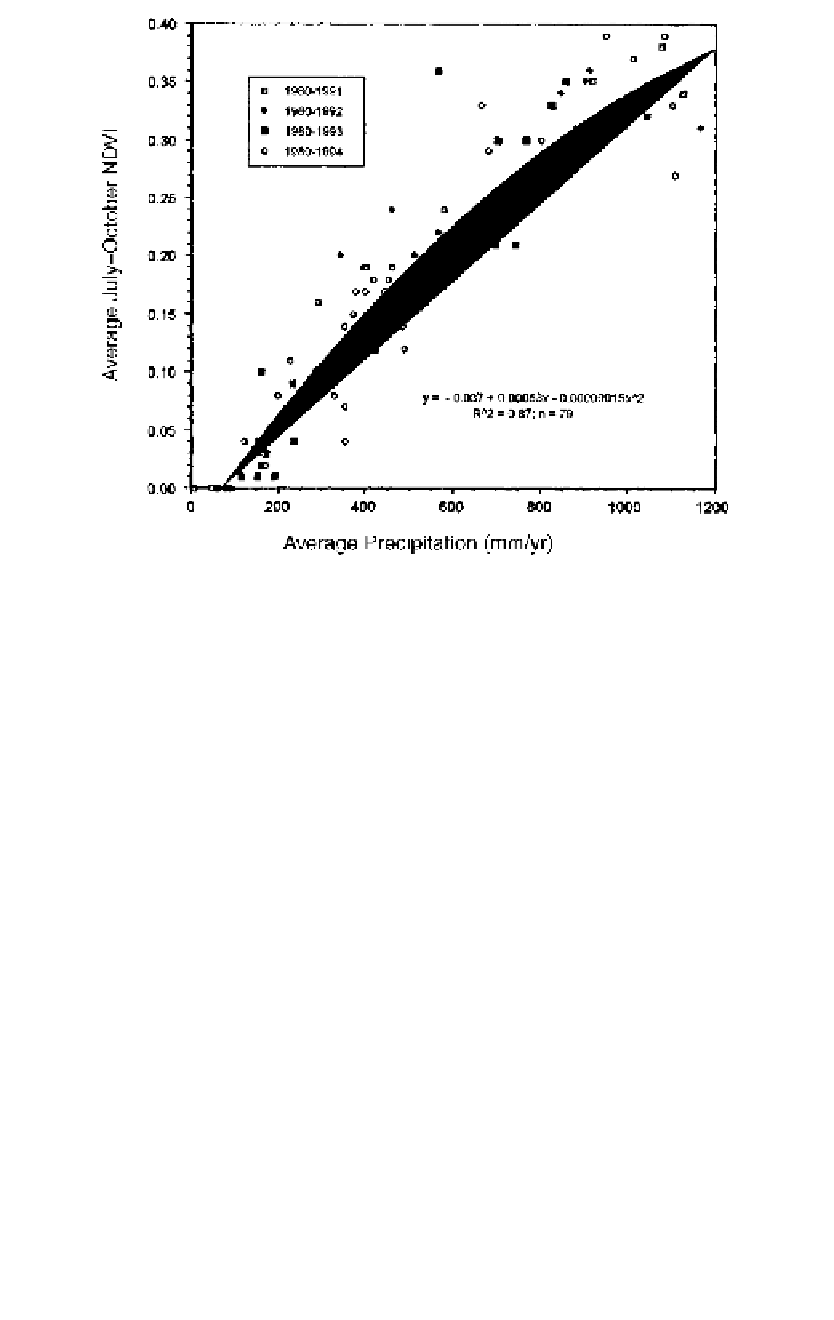
Figure 5.6
Relationship between July-October NDVI and rainfall over West Africa, 1980-97
(fr
om Tucker and Nicholson, 1999).
[67],
spatial resolution), the complexity of crop mixtures with surrounding veg-
etation types, and the small farm sizes that dominate the African land-
scape. Many major organizations, however, operationally use NDVI data
to monitor drought and famine in Africa, such as the Food and Agricultural
Organization's Global Information and Early Warning System (GIEWS;
http://www.fao.org/giews/),
the U.S. Agency for International Develop-
ment's Famine Early Warning System Network (FEWSNET;
http://www.
fews.net/;
chapter 19), and the U.S. Department of Agriculture's Foreign
Agricultural Service (USDA/FAS;
http://www.fas.usda.gov/pecad/pecad.
html).
In all of the following examples for the Sahel, East Africa, and south-
ern Africa, the monthly NDVI data for 20
+
years were used (Tucker, 1996;
Anyamba et al., 2001, 2002; Los et al., 2001).
Th
e Sahel
Prolonged and severe droughts occurred in the Sahel region of Africa in the
1970s and 1980s (Tucker et al., 1983, 1986; Hielkema et al., 1986; Justice
et al., 1986). These droughts were monitored by comparing monthly NDVI
values with the long-term means. Figure 5.7 shows reduction in NDVI
values on account of reduced precipitation for Mali in the Sahelian region
of Africa.


Search WWH ::

Custom Search