Agriculture Reference
In-Depth Information
1
2
3
4
5
6
7
8
9
10
11
12
13
14
15
16
17
18
19
20
21
22
23
24
25
26
27
28
29
30
31
32
33
34
35
36
37
38
39
40
41
42
43
44
45
46
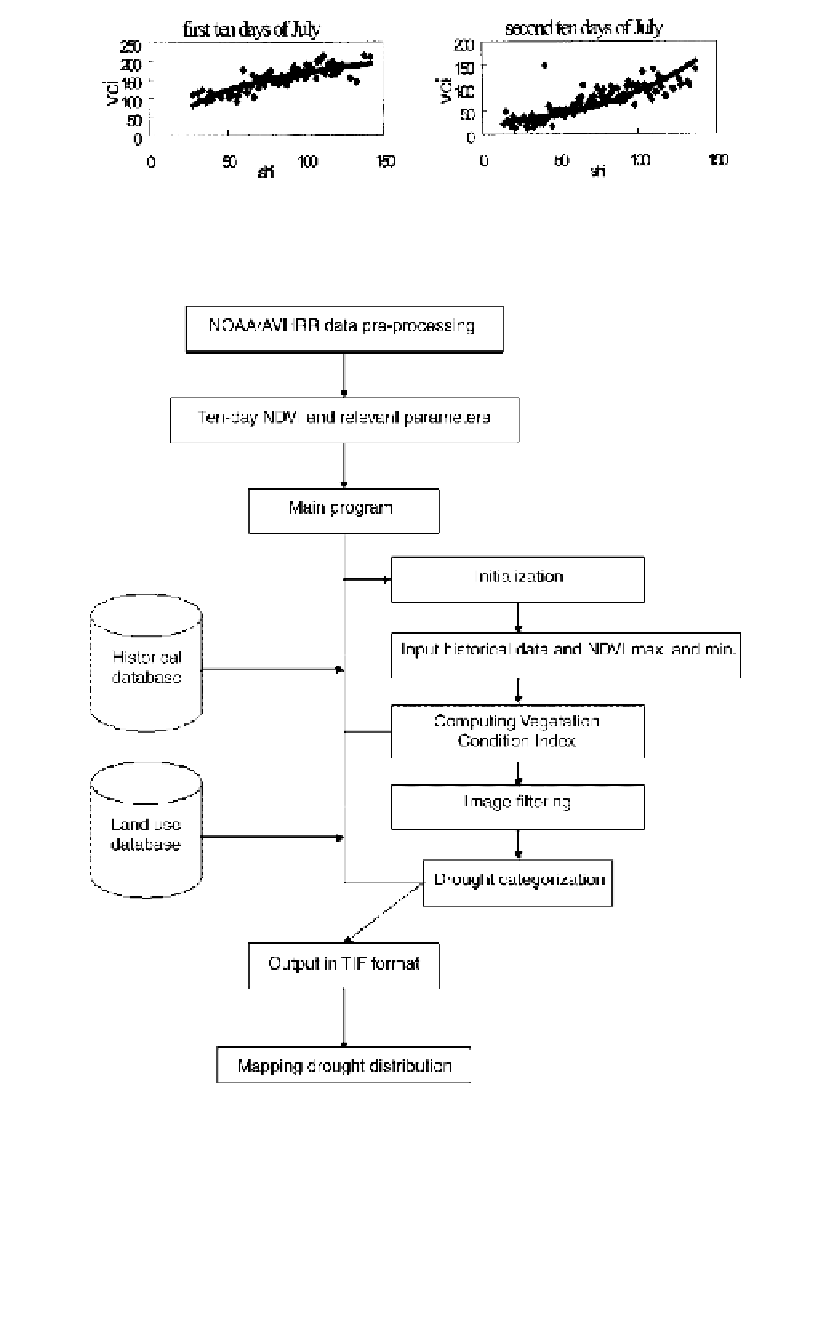
Figure 28.5
The scatter plot between measured soil humidity index (SHI) and vegetation
condition index (VCI).
[365
Line
——
*
25.
——
Norm
PgEn
[365
Fig
ure 28.6
Operational system for drought early warning for China.


Search WWH ::

Custom Search