Agriculture Reference
In-Depth Information
1
2
3
4
5
6
7
8
9
10
11
12
13
14
15
16
17
18
19
20
21
22
23
24
25
26
27
28
29
30
31
32
33
34
35
36
37
38
39
40
41
42
43
44
45
46
[364
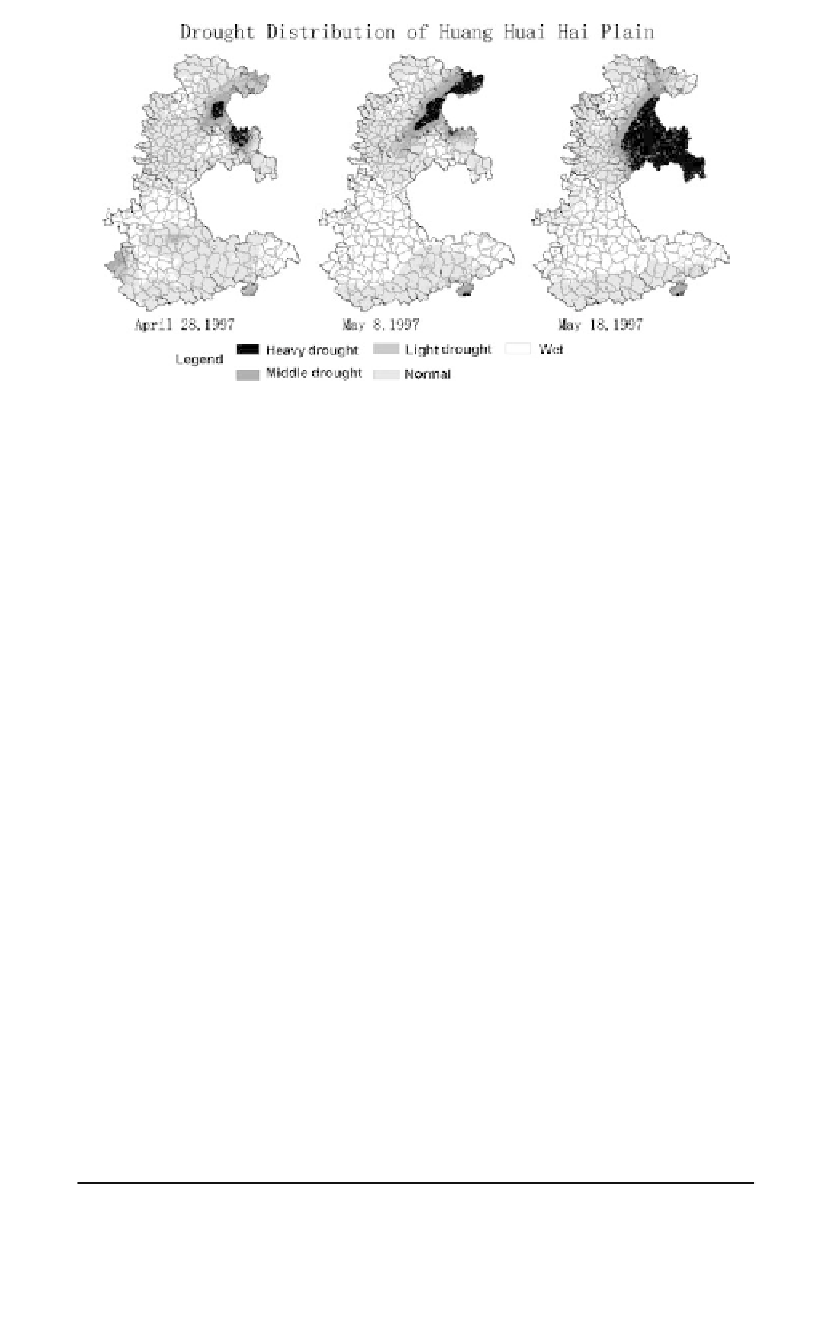
Figure 28.4
Timeslice products for drought monitoring in the North China Plain.
Line
——
-0.2
——
Norm
PgEn
at
20 cm depth and the corresponding field capacity information from 102
ag
ricultural climate observatories (covering the country) for the period
fr
om 1980 to 1994 have been collected. SHI had good correlation with
V
CI (table 28.4, figure 28.5).
The correlation coefficients ranged from 0.60 to 0.85. The test results
of
a statistical model of all 36 ten-day periods from June to December
in
dicated that the model of each dekad passed the test at the level of
α
[364
0.05. Figure 28.6 illustrates an operational system of drought early
w
arning. Some results using this system are shown in figures 28.7 and 28.8.
=
Table 28.4 Statistical model of drought monitoring and associated drought category
Drought categorization
Dekad
in July
Model
R
Range of VCI
Drought category
≤
90
Heavy drought
90-109
Dry
=
+
×
1
VCI
219.2832
83.8763
LN(SHI)
0.846
109-124
Light dry
124-148
Normal
≥
148
Moist
≤
38
Heavy drought
38-44
Dry
2
VCI
=
20.6373
×
exp(0.0152
×
SHI)
0.802
44-51
Light dry
51-70
Normal
≥
70
Moist
≤
31
Heavy drought
31-41
Dry
3
VCI
=
12.736
×
exp(0.0235
×
SHI)
0.856
41-52
Light dry
52-83
Normal
≥
83
Moist


Search WWH ::

Custom Search