Biomedical Engineering Reference
In-Depth Information
d
a
b
c
0.0 0.2 0.4 0.6 0.8 1.0 1.2 1.4 1.6 1.8 2.0 2.2 2.4 2.6 2.8
Distance (mm)
3.0 3.2 3.4 3.6 3.8 4.0 4.2 4.4 4.6 4.8 5.0
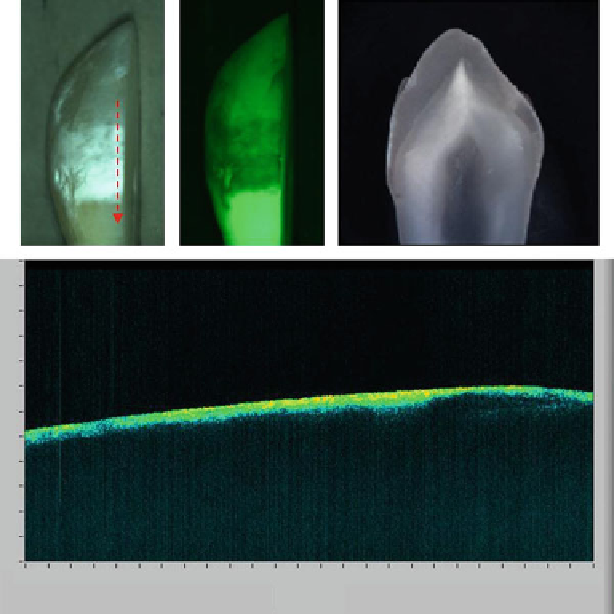
Fig. 9.19
Reflection (
a
), fluorescence (
b
), and OCT images (
d
) of a sectioned tooth. The image
of the tooth section is displayed in (
c
). The
dot arrow
indicates the OCT scanning position and
direction
means there is very little decalcification. This finding is validated by the digital
image of the tooth section (white box in Fig.
9.19
d), which shows just the beginning
stage of decalcification. The OCT image in Fig.
9.19
c also shows the difference
between the white spot (stronger signal due to higher reflection) and the healthy
region even when the decalcification is very shallow.
Unfortunately, stain, calculus, and other debris on the tooth surface can impair the
specificity of fluorescence imaging in caries detection. Figure
9.20
shows that stain
causes false positives in the fluorescence image because the stain appears darker
in the fluorescence image as shown in Fig.
9.20
b. If only a fluorescence image is
available, these darker regions in the fluorescence image could be misinterpreted
as caries. With the polarized reflectance image in Fig.
9.20
a and OCT image
in Fig.
9.20
c, the false positive caused by stain in fluorescence image can be
avoided.
The above ex vivo experimental results demonstrate that the multimodal imag-
ing system incorporating polarized reflectance, fluorescence, and OCT imaging
Search WWH ::

Custom Search