Biomedical Engineering Reference
In-Depth Information
a
b
d
c
0.0 0.5 1.0 1.5 2.0 2.5 3.0 3.5 4.0 4.5 5.0 5.5
Distance (mm)
6.0 6.5 7.0 7.5 8.0 8.5 9.0
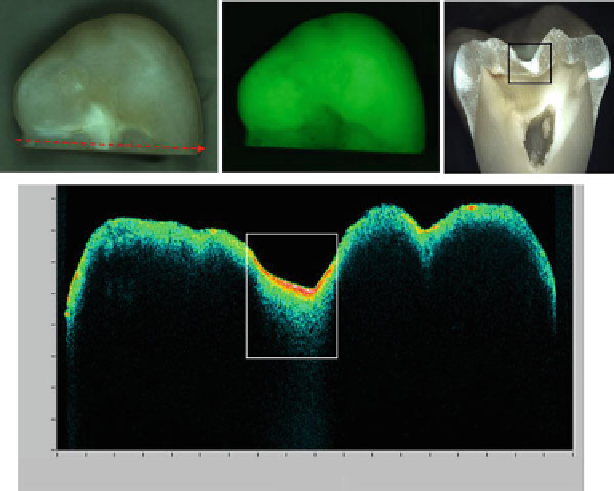
Fig. 9.18
Visible reflectance (
a
), fluorescence (
b
), and OCT (
d
) images of the occlusal surface of
a sectioned tooth. (
c
) The image of the tooth section. The dotted arrow shows the OCT scan line
and direction. The caries captured by OCT (
white box
in (
d
)) correlates well with that in the section
image (
black box
in (
c
)). The
dot arrow
indicates the OCT scanning position and direction
Extracted tooth samples were used to demonstrate the performance of the
multimodal imaging system for dental caries detection. After the teeth were
extracted, they were placed in a fresh solution of chloramine T 0.5 % for 3 days
for sterilization. Some tooth samples were sectioned to correlate OCT images with
tooth structural information beneath the tooth surface. For each tooth sample, the
imaging system captured and saved all three images: visible polarized reflectance,
fluorescence, and OCT.
Figure
9.18
shows the three images obtained with the multimodal system on
the occlusal surface of a sectioned tooth, along with an image of the tooth
section. All three images clearly show that there is a carious region: a white
spot in the reflectance image (Fig.
9.18
a), a dark area in the fluorescence image
(Fig.
9.18
b), and the large depth of the scattering profile in the center of OCT image
(Fig.
9.18
c). The carious region is also verified by the tooth section (black box in
Fig.
9.18
d).
Figure
9.19
demonstrates a case in which OCT is able to identify false positives
in the reflectance and fluorescence images. The white spot in the visible reflectance
image (Fig.
9.19
a) and the dark region in the fluorescence image (Fig.
9.19
b) both
indicate the presence of caries. However, the OCT image in Fig.
9.19
c only shows
small variation in the shallow depth of scattering profile across the scan line, which
Search WWH ::

Custom Search