Biomedical Engineering Reference
In-Depth Information
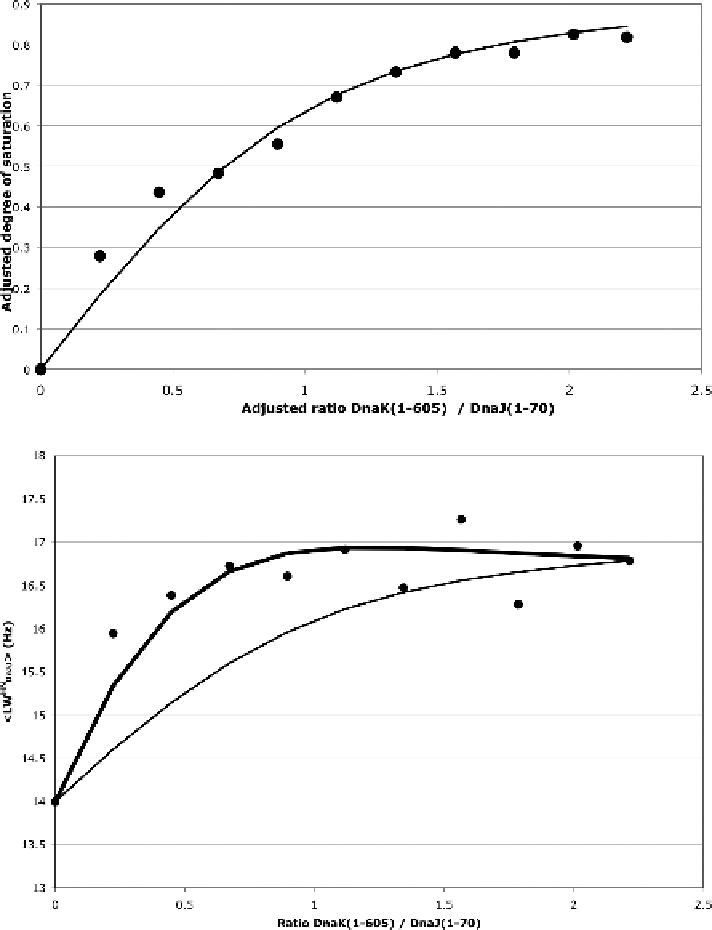
Figure 10.17
(a) Chemical shift changes of the
1
H-
15
N cross peaks of DnaJ(1-70)
during titration with DnaK (1-605). The data points are averages of the
chemical shift changes for all residues. The fit corresponds to K
D
5 16
mM. (b) The
1
H linewidths of the
1
H-
15
N cross peaks during titration.
The thin line represents the function R
2
~f
free
R
fre
2
zf
bound
R
boun
2
where
f
free
and f
bound
were calculated for K
D
5 16 mM for the protein
concentrations in the experiment. The heavy line is a fit using the
same
K
D
but
allowing
for
chemical
exchange
broadening
R
2
~f
f ree
R
fre
2
zf
bound
R
boun
2
z
f
f ree
f
bound
Dv
2
yielding to a k
ex
of 14
k
ex
s
21
. Adapted from ref. 32.