Biomedical Engineering Reference
In-Depth Information
O
OH
O
Br
3.13
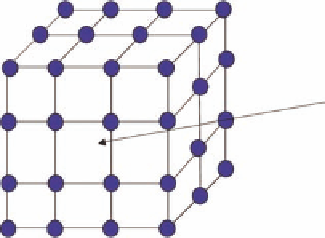
FIGURE 3.12
Setup for calculation of molecular interaction i elds.
probe-molecule interaction energy (
E
tot
) between the probe and the molecule is calculated by an
empirical force-i eld as a sum of the vdW energy (
E
vdW
), the electrostatic energy (
E
el
), and the hydro-
gen bond energy (
E
hbond
) as shown in Equation 3.1
EEEE
=
+
+
(3.1)
tot
vdW
el
hbond
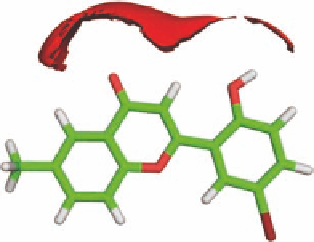
The molecular interaction i eld for each probe may be visualized by calculating and displaying
isoenergy contours at a user-dei ned energy level. Examples of isoenergy contours are shown in
Figure 3.13, displaying the results of GRID analyses for the substituted l avone
3.13
.
Figure 3.13a shows the GRID results using a water probe. As expected, contours are observed
around the carbonyl group and the hydroxy group indicating strong hydrogen bond interactions
between the water molecule and
3.13
. However, water can donate as well as accept hydrogen bonds
but these two modes of interaction cannot be distinguished by the use of a water probe. By choosing
an NH
+
probe, which can only donate a hydrogen bond, and an O
−
probe, which can only accept a
hydrogen bond, donating and accepting can be distinguished. This is shown in Figure 3.13b, where
the blue contour indicates hydrogen bond accepting by the carbonyl group and the red contour
hydrogen bond donating by the hydroxy group.
Molecular interaction i elds may be used to identify potentially important interactions between
a ligand and a protein. The probes are then representing different types of interaction partners in
the binding pocket of the protein. However, a more powerful use of molecular interaction i elds in
ligand-based drug design is the combination of these i elds with statistical chemometric methods to
develop a 3D-QSAR model for the quantitative prediction of biological activities. The basic idea is
(a)
(b)
FIGURE 3.13
Isoenergy curves for compound
3.13
and (a) a water probe contoured at -21 kJ/mol and
(b) an amine cation (NH
+
) probe contoured at −26 kJ/mol (blue) and a phenolate anion oxygen (O
-
) probe
contoured at −16 kJ/mol (red).