Biomedical Engineering Reference
In-Depth Information
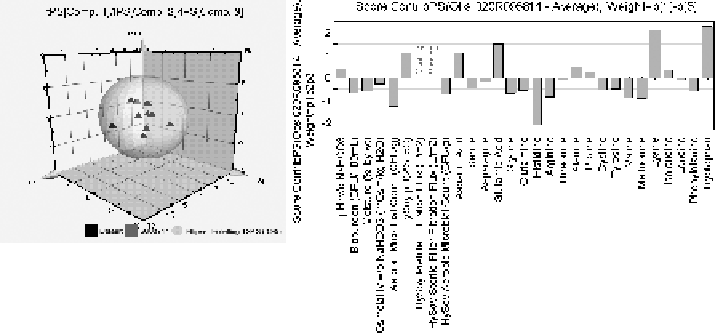
Figure
12.8. PC score 3D plot (top) showing various grades of raw materials and variable
contribution plot (bottom) indicating the raw material constituent differences between the
historical lots (black triangles) and a new lot (red triangle). (See the insert for color representa-
tion of this figure.)
PLS is a linear empirical modeling technique that reduces model dimensionality
while retaining the useful information in the data. PLS rearranges process variables
space (denoted as X) and response variables space (denoted as Y) by reducing their size
(in terms of number of actual variables) while maximizing the covariance between
them. For instance, when the three process variables (X
1
, X
2
,andX
3
)depictedin
Fig. 12.7 and one response variable (y) are to be correlated, the PLS model reduces the
original predictor variable dimensions into a selected few latent variables (LAs) that
are basically defined as weighted linear combinations of process variables (predictors).
Firstlatentvariable(LV
1
) is selected as the direction of maximumvariability of X space
that is most predictive of the y space. Once the first LV is determined, amount of
variance it can explain is removed from the X and y spaces, and a second iteration is
carried out by using the residuals of X and y to determine the second LA direction.
Therefore, the second (LV
2
) latent variable is selected as the direction of the remaining
maximum variability of X space that is most predictive of the residual y space. In this
example, most of the variation in the data set can be explained by using two LVs instead
of three process variables.
The model dimensionality or the number of latent variables used in each model is
determined by cross-validation. In cross-validation, each batch is removed from the
data set once and a new PLS model is developed by using the remaining batches. The
response variables (Y) of the left-out batch are then predicted by the model and
compared with the actual values. A number of cross-validation statistics (including
predicted residuals sum of squares (PRESS)) can be then calculated to determine the
model dimensions (i.e., number of latent variables) and model's power in explaining
variance [34, 35].
The followingmultivariate statistics and charts are typically used during exploratory
analysis, monitoring, and prediction [58, 59] of batch/fed-batch processes.