Biomedical Engineering Reference
In-Depth Information
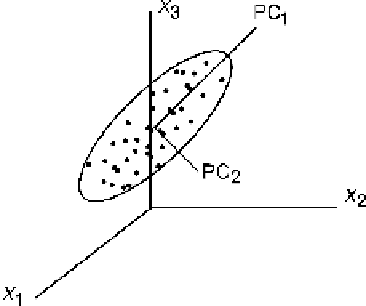
Figure
12.7. PCA representation of a three-variable process.
PCs. When there are many more variables, this becomes a great advantage as it enables
summarizing overall variability with a few variables. Once a PCAmodel is developed, it
can be used to quickly identify separations in the data set, if there is any, and one can
relate this difference to original variables that are used in the model.
One example is the raw material data (related to raw material constituents, such as
physical and chemical characteristics); when the data are available for different lots of
the same raw material, one can quickly analyze if there is any major difference between
them with respect to the variables measured (usually there are many variables measured
including the spectral data) as shown in Fig. 12.8. The 3D-score plot on the left indicates a
summary of the entire raw material variability (defined by the confidence volume of the
ellipsoid) for all of the measured variables (in this example, both physical, such as
particle size and filterability, and chemical characteristics, such as amino acids, are
used). Measurements from a new rawmaterial lot are projected onto this PCA model for
quick comparison that shows no major difference overall. However, some variables such
as the number of amino acids are found slightly different by studying the contribution
plot on the right-hand side of Fig. 12.8.
When there is a need to explore multivariate correlations (say, input variables or
predictors) against one or more response variables (i.e., outputs or predictees), a variety
of regression techniques are used in chemometrics.
Colinearity exists when two variables change in the same direction. ordinary
linear regression (OLR) techniques fail to handle this type of complex data due to
ill-conditioned covariancematrices causing an inability to take the inverse of the solution
matrix leading to regression coefficients. Various alternative regression techniques have
been developed and offered by chemometrics research community in the past 20 years
that can be referred to as biased regression, reduced-rank regression, and subspace
modeling regression. Some of the techniques that are widely used include principal
components regression, partial least squares, and ridge regression. We will cover one of
them that is widely used in practice and called partial least squares (or projection to latent
structures).