Biomedical Engineering Reference
In-Depth Information
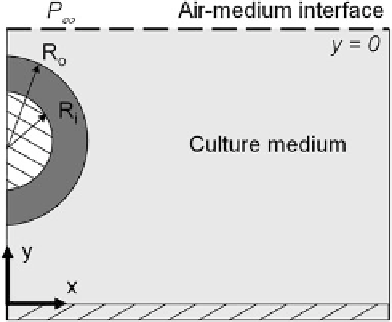
Fig. 1 Illustration of domain
for DO transport problem of
tubular tissue constructs
cultured statically around a
glass mandrel in a culture
dish (not to scale). Schematic
represents the symmetric
domain as it was entered into
COMSOL Multiphysics with
two subdomains, which
consisted of culture medium
surrounding the DO-
consuming engineered tissue
C
O
2
j
y
¼
0
¼
a P
1
ð
2
:
3
Þ
r
¼
R
i
o
C
O
2
or
¼
0
ð
2
:
4
Þ
J
O
2
;
tissue
r
¼
R
o
¼
J
O
2
;
fluid
r
¼
R
o
ð
2
:
5
Þ
The problem was further simplified by implementation of a symmetry plane at
x = 0.
DO profiles were modeled using the finite element method (FEM) software
package COMSOL Multiphysics (version 3.5a, COMSOL, Inc.). The model was
solved using the UMFPACK stationary solver with a convergence tolerance of
10
-6
and a minimum damping factor of 10
-4
. Numerical values used in this and
subsequent models are shown in Table
1
.
In order to provide values for V
max
and K
m
, the oxygen consumption rate (OCR)
was measured for neonatal human dermal fibroblasts (nhDFs) using a stirred
microchamber and an oxygen monitoring system as described in Bjork and
Tranquillo [
23
]. Measurements provided by this system provided changes in DO
due to metabolic oxygen consumption inside an impermeable microchamber. V
max
was determined on a per-cell basis by Eq.
2.6
[
27
]:
V
max
¼
V
ch
a
N
cell
Dp
O
2
Dt
ð
2
:
6
Þ
where V
ch
is the volume of the microchamber, a is the Bunsen solubility coefficient
(1.27 nmol/cm
3
/mmHg at 37C[
28
]), and N
cell
is the number of cells in the sample
as determined by DNA quantification and a cell viability assessment. Dp
O
2
=
Dt is
the slope of the linear portion of the curve obtained from the oxygen monitoring
data. The OCR data obtained with the microchamber was used to determine K
m
by
plotting OCR versus the oxygen concentration. The concentration at which the
OCR was one-half V
max
was taken as K
m
.
Search WWH ::

Custom Search