Biomedical Engineering Reference
In-Depth Information
(a)
0.25
Keratinocyte
0.2
0.15
0.1
Fibroblast
0.05
0
Chalier's class interval (Length [pixels])
(b)
0.35
0.3
Keratinocyte
0.25
0.2
0.15
Fibroblast
0.1
0.05
0
Chalier's class interval (Z- score [-])
(c)
0.35
0.3
Keratinocyte
0.25
0.2
0.15
Fibroblast
0.1
0.05
0
Chalier's class interval (Z score [-])
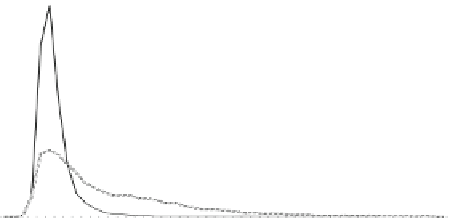
Fig. 10 Parameter distribution comparing keratinocytes and fibroblasts. a Distribution of length
between two types of cells. There is huge overlapping area in one parameter distribution.
b Distribution of Z-score from the discriminant analysis using 19 morphological features between
two types of cells. There is still overlapping area even after the discriminant modeling.
c Distribution of Z-score from the discriminant analysis using 19 morphological features using
''noise reduced data''. Noise objects were excluded from the discriminant analysis by eliminating
the group N_s and N_l objects from the data. Such noise data c reduction greatly reduces
overlapping area from cell distributions


Search WWH ::

Custom Search