Biomedical Engineering Reference
In-Depth Information
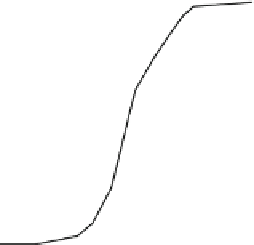
Fig. 8 Comparison between
experimental data and model
predictions in terms of PIIF at
-40C for a population of rat
hepatocytes at different
cooling rates when CPA is
absent (adapted from [
9
])
Experimental data
[40]
1.0
0.8
Model prediction
[9]
[40]
0.6
0.4
0.2
0.0
10
100
1000
Cooling rate, B [°C/min]
Interestingly, this behaviour of an abrupt increment of PIIF at a certain temperature
could be obtained through our model if a population of identically sized cells was
taken into account. The successful comparisons reported in Figs.
7
and
8
demon-
strate that taking into account the cell size distribution allows one to better predict
the response of a cells suspension to a cryo-preservation process.
For sake of brevity a comprehensive list of all parameters values necessary for
the model is not given here. The interested reader is invited to refer to the original
papers summarised in the present one for collecting all the parameters values used
in the simulations [
9
-
11
].
3.2 The Effect of Cooling Rate
Starting from the successful experimental validation, a series of model simulations
have been performed. In particular, the PBM approach has been used to investigate
theoretically the effect of the cooling rate on the fate of the size-distributed cell
population reported in Fig.
3
. Initially, the case of extra-cellular ice formed under the
assumption of thermodynamic equilibrium conditions and without using a CPA has
been analysed at different cooling rates. Then, the dynamics of EIF has been
accounted for and the simulations have been repeated. This way, the effect of cooling
rate in absence of CPA may be investigated also by evaluating if the classic
assumption of thermodynamic equilibrium conditions for EIF may play a role.
Three different cooling rates have been adopted, namely -1, -50 and -400C/
min. These represent practicable values for the current technology on standard
cryopreservation of a cell suspension [
10
]. The model results corresponding to the
three cooling rates in absence of CPA are compared on Fig.
9
in terms of size dis-
tribution at different times and PIIF as a function of temperature.


Search WWH ::

Custom Search