Biomedical Engineering Reference
In-Depth Information
Extensor Digitorum
2
0
-2
0
0.5
1
1.5
2
2.5
3
3.5
4
x 10
4
Abductor Pollicis Brevis
2
0
-2
0
0.5
1
1.5
2
2.5
3
3.5
4
x 10
4
Hand grasp
Position of index finger
Hand
opening
200
100
0
0
0.5
1
1.5
2
2.5
3
3.5
4
x 10
4
Time (ms)
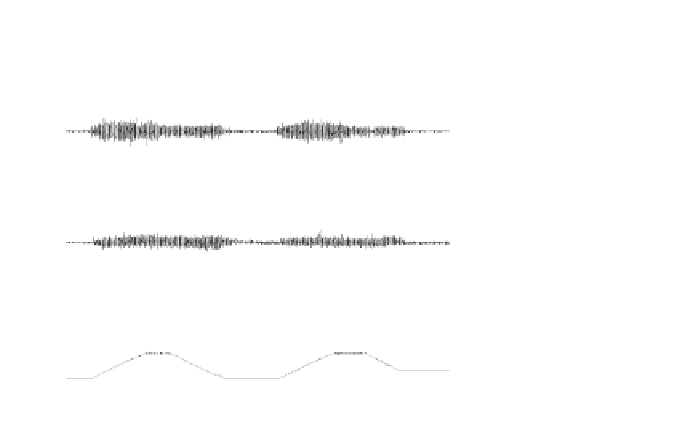
Figure 6.11f
Continuous EMG-driven motion for stroke subject S4. Top 2 rows are the
EMG signals for ED and APB muscle groups. The bottom row is the position feedback of
index finger movement.
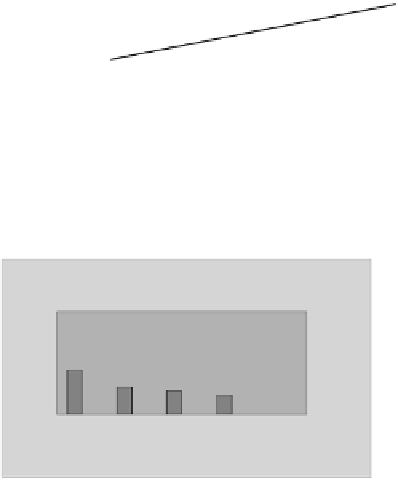
a)
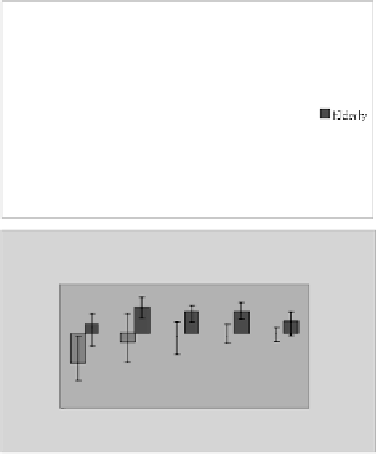
b)
Figure 6.12
Maximum voluntary force between stroke and elderly groups during (a) hand
grasp and (b) hand opening. The vertical bar is the maximum and minimum value within
the group. The shaded bar is the mean value within the group. For color reference, see
page 216.
6.4.3 Range of motion analysis
In the continuous EMG-driven mode, the movement is driven by the subjects'
intention continuously. If the subject had difficulty in driving the system continu-
ously, the range travelled would be less than 100%.