Graphics Programs Reference
In-Depth Information
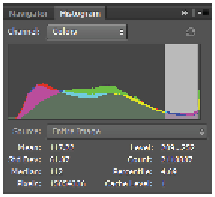
The original histogram.
6
Click and drag the right side of the Histogram to see that the level values are in the 200's. The high
levels on the right side of the histogram represent the lighter sections of this RGB image. Click and
drag on the left side of the Histogram to see that the levels are low, indicating that this is the darkest
section of the image.
Click and drag on the Histogram to see values.
Images in the Histogram panel are represented in 255 levels or tonal values of colors. Zero (0)
represents black and 255 represents white. To help you remember this concept, think about color
being created with light. If you have a flashlight that is off (i.e., level 0), it is totally dark or black.
If the flashlight is turned on (i.e., level 255), you have bright white.
When you start to understand that the right side of the Histogram represents the light values and the left
side the dark values, it might make sense to you that, since the data in this file starts away from the
edges, the image doesn't have a great amount of darks and lights. You can therefore conclude that this
image is a little washed out, or lacks contrast. There is no easy formula for improving brightness and
contrast, but you will use the Curves panel in this lesson to improve those aspects of your image as well.
7
Choose File > Save. Keep this file open for the next part of this lesson.
Why do Histograms look different?
Histograms will vary depending on the type of image you are viewing. Your scanner, camera's capabilities,
the scene lighting, or camera settings, can all have an effect on your Histogram. There are also different types
of images that you should be aware of, since they can affect the Histogram as well.
A light image is called a “high-key” image. In a high-key image, the data is heavy on the right side of the
Histogram.