Graphics Programs Reference
In-Depth Information
The science of color is sometimes called chromatics, chromatography,
colorimetry
,
or simply color scien-
ce. It includes the perception of color by the
human eye
and brain. Making color adjustments can be in-
consistent, since the color of an object depends on both the physics of the object in its environment and
the characteristics of the perceiving eye and brain. To put this simply, not only does the lighting in the
original location of the image have an effect on the image, but the lighting that you are working in affects
your image as well. If you are working in an office environment, you might discover that you are correct-
ing to the green cast that your fluorescent lights are producing. In addition to that, you could have a win-
dow streaming sunlight at various times of the day, producing additional color variations in your work
environment. This is why this lesson is focused on reading values instead of making changes based
strictly upon the visual appearance of your image.
Tools you will use
In this lesson, you will take advantage of two panels that you might not have needed in the past: the Info
panel and the Histogram.
Using the Histogram panel
Understanding image histograms is probably the single most important concept to becoming familiar
with Photoshop. A histogram can tell you whether your image has been properly exposed, whether the
lighting is correct, and what adjustments will work best to improve your image. The histogram will also
indicate whether the image has enough tonal information to produce a quality image. You will reference
the Histogram panel throughout this lesson.
1
Choose File > Browse in Bridge. When Adobe Bridge appears, navigate to the advps05lessons folder
that you copied onto your hard drive.
2
Locate the image named
advps0501.psd
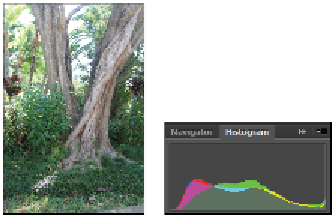
and double-click it to open in Photoshop. An image of a tree
appears. Given that the tree was not shot with professional lighting or expertise, the image offers
many issues that need to be addressed.
3
Choose File > Save. In the Save As dialog box, name this file
advps0501_work
and keep it in the
PSD format. Choose to save this file in the advps05lessons folder.
4
Choose Windows > Histogram to show the Histogram panel. Notice that the Histogram is rather full
and spread across the span of the panel at this point.
5
Select Expanded View from the Histogram panel menu in the upper-right corner. You can now read the
levels in the image as you drag your mouse across the histogram.
The original tree image.