Environmental Engineering Reference
In-Depth Information
6
(a)
Maximum
Mean
Minimum
4
2
0
-2
-4
-6
-8
100
200
300
400
500
600
700
800
900
Chainage (m)
3
(b)
Maximum
Mean
Minimum
2.5
2
1.5
1
0.5
0
0
1.0
2.0
3.0
4.0
5.0
Wave Heights (m)
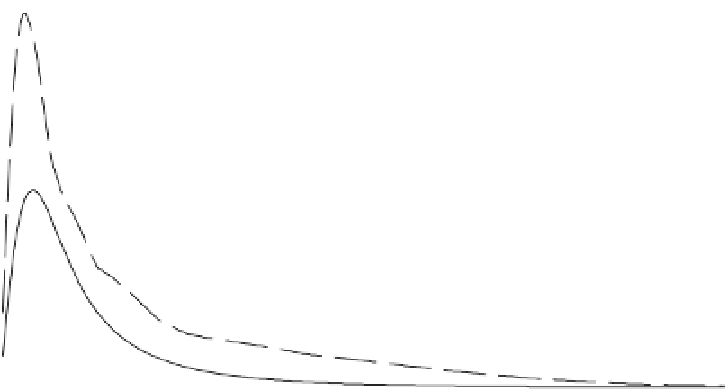
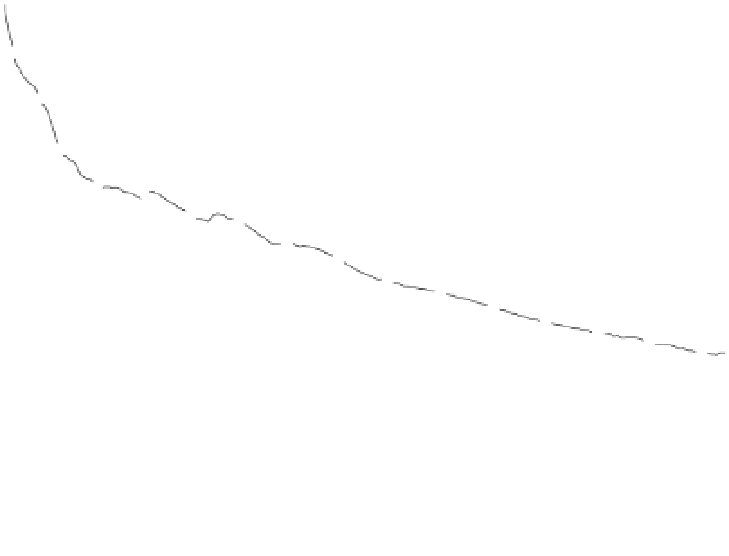
Fig. 16.7
(a) Mean, upper and lower envelope of measured beach profiles; (b) mean, upper and lower envelope of
Rayleigh wave height probability density functions (pdf) used as input in the canonical correlation analysis (CCA).
Rayleigh distribution
The Rayleigh distribution has proven to be a
reasonable measure of the wave height distribu-
tion for waves in deep water and is defined as:
To represent thewave climate, probability density
functions (pdfs) were derived from the wave
heights. The pdfs ofwaves between two successive
beach surveys were assigned to the later survey.
The physical justification of this is that the
changes in the beach profile represent the cumu-
lative effect of all the waves impinging on the
beach since the previous measurements.
i
2
N
X
N
H
H
rms
0
;
2
H
H
rms
0
;
i
1
e
p
N
¼
ð
16
:
2
Þ
i
¼
1
where p
N
is a combined probability density func-
tion of wave heights
that
is derived by