Information Technology Reference
In-Depth Information
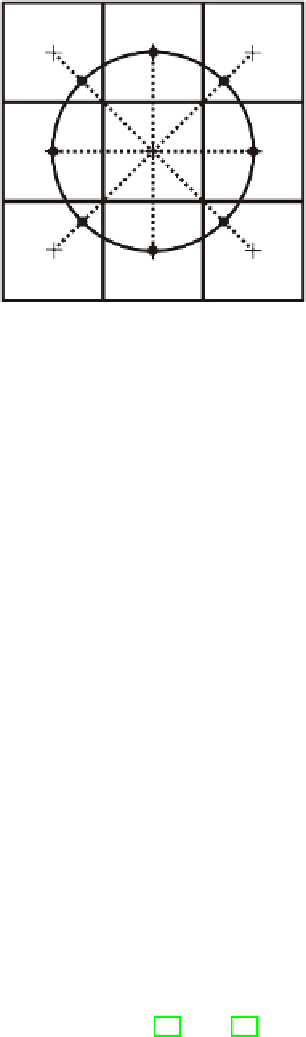
Fig. 1.
Reference schema for cells altitude determination in the Moore neighbourhood. Altitudes
of cells belonging to the von Neumann neighbourhood correspond to normal DEM values, while
those along diagonals are taken at the intersection between the diagonal line and the circle with
radius equal to the cell side, so that the distance with respect to the centre of the central cell is
constant for each adjacent neighbour.
methodology requires the analysis of the past behavior of the volcano, for the pur-
pose of classifying the events that historically interested the region. In such a way, a
meaningful database of plausible simulated lava flows can be obtained, by character-
izing the study area both in terms of areal coverage, and lava flows typologies. Once
the simulation database has been completed (i.e., an adequate, usually elevated, num-
ber of simulations have been carried out), data is processed by considering a proper
criterion of evaluation. A first solution could simply consist in considering lava flows
overlapping, by assigning a greater hazard to those sites interested by a higher number
of simulations. However, a similar choice could be misleading. In fact, depending on
their particular traits (e.g., location of the main crater, duration and amount of emit-
ted lava, or effusion rate trend), different events can occur with different probabilities,
which should be taken into account in evaluating the actual contribution of performed
simulations with respect to the definition of the overall hazard of the study area. In
most cases, such probabilities can be properly inferred from the statistical analysis of
past eruptions, allowing for the definition of a more refined evaluation criterion. Ac-
cordingly, in spite of a simple hitting frequency, a measure of lava invasion hazard can
be obtained in probabilistic terms. In the following, we show how such approach was
applied to Mt Etna.
3.1
Application of the Methodology to the Mt. Etna Volcano Area
By adopting a procedure well described in [17] and [34], which referred to the Eastern
sector of Mt. Etna and applied by employing a previous version of the SCIARA CA
model, we here show the application to the entire area of the volcano using the new
SCIARA model described in Section 2. Firstly, based on documented past behavior
of the volcano, the probability of new vents forming was determined, resulting in a
characterization (thus, a Probability Density Function - PDF - map) of the study region
Search WWH ::

Custom Search