Information Technology Reference
In-Depth Information
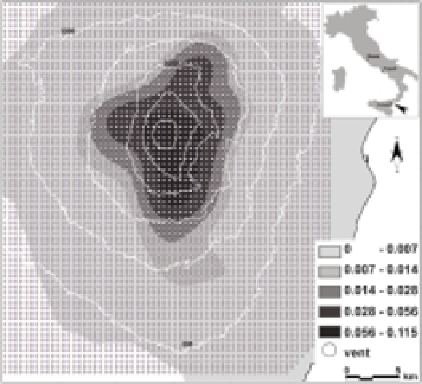
Fig. 2.
The characterization of new vents forming of the study region on the basis of historical
data (see text), representing different probabilities of activation, considered in this work, together
with the grid of 4290 hypothetical vents defined as the source for the simulations to be carried
into areas (Figure 2), that represent different probabilities of new vents opening [35],
assessed by employing a Poisson distribution which considers a spatial density and a
temporal component. The spatial probability density function was estimated through
a Gaussian kernel by considering the main volcanic structures at Mt Etna, while the
temporal rate was evaluated by using an approach based on the “repose-time method”
[36].
Subsequently, all flank eruptions of Etna since 1600 AD were classified according
to duration and lava volume [17] and a representative effusion rate trend taken into
account in order to characterize lava temporal distribution for the considered represen-
tative eruptions, basically reflecting the effusive mean behavior of Etnean lava flows. In
fact, with the exception of few isolated cases, a typical effusive behavior was strongly
evidenced by the analysis of the volcano past activity [37]. As a consequence, it is not a
hasty judgment to suppose that such behavior will not dramatically change in the near
future and thus that the SCIARA lava flows simulation model, calibrated and validated
on a set of effusive eruptions, be adequate for simulating new events on Mt Etna. An
overall probability of occurrence,
p
e
, was thus defined for each scenario, by considering
the product of the individual probabilities of its main parameters:
p
e
=
p
s
· p
c
· p
t
(4)
where
p
s
denotes the probability of eruption from a given location (i.e., based on the
PDF map),
p
c
the probability related to the event's membership class (i.e., emitted lava
and duration), and
p
t
the probability related to its effusion rate trend.
Once representative lava flows were devised as above, a set of simulations
wereplannedtobeexecutedinthestudyareabymeansoftheSCIARAlavaflowssimula-
tion model. At this purpose, a grid composed by 4290 craters, equally spaced by
500
m
,


Search WWH ::

Custom Search