Information Technology Reference
In-Depth Information
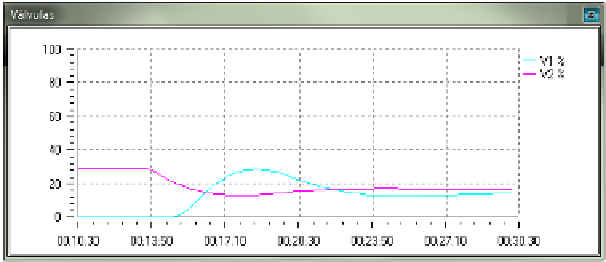
Fig. 6.
Control Signals
Fig. 7.
PID interface
PID controllers implement the main aspects of the industrial controllers. Pressing
the left mouse button placed on each PID controllers, the GUI for managing the cor-
responding PID is shown (Fig. 7). The bar graph lets you see (graphically and numer-
ically) the value of the process variable (PV in blue), set point (SP in red) and output
to process or control signal (OP in yellow). The user can select the controller mode
(Automatic, Manual or Cascade). In AUTO mode, he can specify the SP value and, in
MAN mode, the OP value. In manual mode, the user can activate the SP tracking


Search WWH ::

Custom Search