Information Technology Reference
In-Depth Information
Fig. 4.
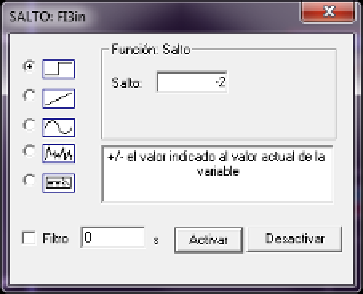
Change boundary condition
indicator of the P&ID. So, an experiment is made in which a step from 5 to 3 m
3
/h in
FI3 signal is activated (Fig. 4).
Initially, the outlet and pumped flow are equals and greater than the minimum
pumped flow (3.6 m3/h) and therefore V1 is closed and FI4 is zero. As FI3 step result,
FC2 and FC1 will be under the minimum pumped flow and the controller of minimum
flow must act. First, FI3 decreases from 5 to 3 m
3
/h. The tank level decreased and LC1
acts decreasing FC2 SP. Consequently, the outlet and pumped flows (in Fig. 5, FI1 and
FI2) decrease simultaneously. When the pumped flow (FI1) is under the minimum
pumped flow, FC1 acts opening V1 and, as result, FI4, the tank level and FI1 are in-
creased and the pumped flow raises the minimum pumped flow value.
Clicking on the control signals or variables displays, trend charts showing the per-
formance of the control structure are shown. These charts can be configured by the
user. Fig. 5 shows the flows performance and Fig. 6 the dynamic of the control
signals.
Fig. 5.
Process and control structure response


Search WWH ::

Custom Search