Environmental Engineering Reference
In-Depth Information
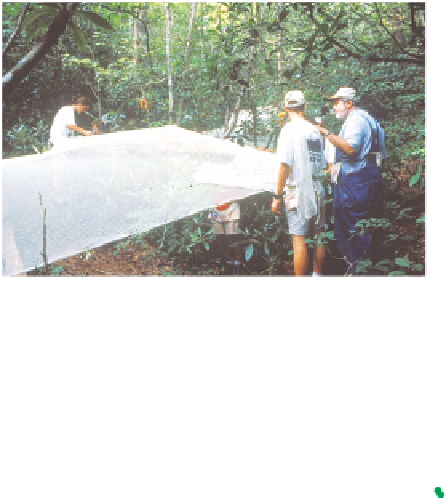
FIGURE 3.6
Setting up a whole-stream experiment to exclude inputs of leaf litter from a small stream at the
Coweeta Hydrologic Laboratory, North Carolina (some results of this experiment are shown in
Figure 3.5
).
(Photograph by John Hutchens.)
(a)
(b)
100
100
10
10
1
1
0.1
0.1
0.01
0.01
0.01
0.1
1
10
0.01
0.1
1
10
Producer phosphorus concentration
(% dry mass)
FIGURE 3.7
Percentage of net primary production ingested by all herbivores in various aquatic (green sym-
bols) and terrestrial (purple symbols) ecosystems, as a function of nitrogen (a) and phosphorus (b) content of the
primary producers. This figure shows that food quality may influence metabolic activity by guilds of consumers.
(Redrawn from
Cebrian and Lartigue 2004.
)
Producer nitrogen concentration
(% dry mass)
top-down control by herbivores may be most frequent in aquatic ecosystems (
Cebrian and
Lartigue 2004
), and the ratio of herbivore production to primary production should tend
to be very much higher in aquatic ecosystems than terrestrial ecosystems.
PRODUCTION OF THE ENTIRE COMMUNITY
OF CONSUMERS
In contrast to the previous cases, where only approximate, statistical estimates of pro-
duction are available, production by the entire community of consumers in an ecosystem