Environmental Engineering Reference
In-Depth Information
(a)
(b)
1000
200
I
I
I
I
I
100
I
I
I
I
I
I
20
V
V
I
10
I
V
V
V
V
V
I
V
V
V
1
V
2
V
0.1
I
V
V
0.2
0.01
2
20
200
2000
100
1000
10,000
100,000
Net primary productivity kJ m
-2
yr
-1
Net primary production (mg C/m
3
-d)
(c)
(d)
12
12
Total
Primary consumers
Predators
Predators vs. primary
consumers
Predators vs. total
production
10
8
8
5
4
2
0
0
0
50
100
150
200
250
0
4
8
12
Mean annual leaf litter standing crop
(g AFDM/m
2
)
Primary consumer or total production
(g AFDM · m
-2
· yr
-1
)
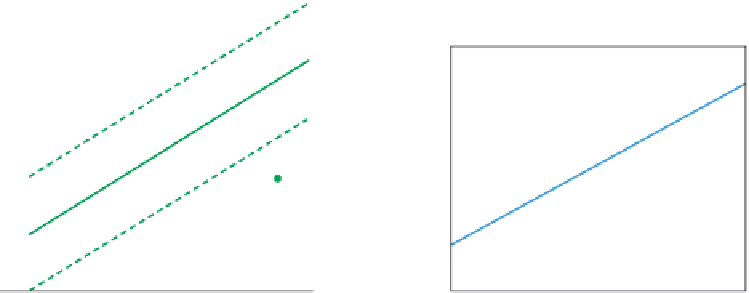
FIGURE 3.5
Production of a guild of consumers often is correlated with the supply rate of its food. (a)
Bacterial production as a function of net primary production in various freshwater and marine pelagic ecosys-
tems.
(Redrawn from
Cole et al. 1988.)
(b) Herbivore production in terrestrial ecosystems as a function of net pri-
mary production. Dominant herbivores were vertebrates (V) or invertebrates (I).
(Redrawn from
McNaughton et al.
1991.)
(c) Production of aquatic insects as a function of leaf litter standing crop in a small Appalachian stream
from which litter was experimentally excluded. (d) Production of predatory insects as a function of production of
prey insects in the same stream.
((c) and (d) redrawn from
Wallace et al. 1999.
)
Guild-level analyses also show important energetic differences between aquatic and ter-
restrial ecosystems. Herbivore ingestion (as a percentage of primary production) is higher
in aquatic than terrestrial ecosystems because primary producers tend to be more nutrient-
rich in aquatic ecosystems than in terrestrial ecosystems (
Figure 3.7
). The higher nutrient
content of aquatic primary producers should also lead to higher assimilation efficiencies in
aquatic consumers than their terrestrial counterparts, and the relative rarity of homeo-
thermy should lead to higher net growth efficiencies in aquatic ecosystems. Consequently,