Digital Signal Processing Reference
In-Depth Information
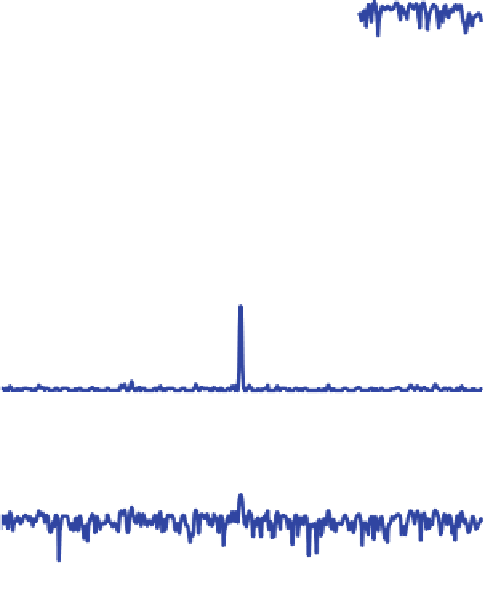
SIGNAL X1: A=1,f1
=
150 Hz
0.2
0.15
0.1
0.05
0
0
100
200
300
400
500
f
SIGNA
L
X1: A=1,f
1
=150 Hz
10
0
10
-5
10
-10
0
100
200
300
400
500
f
Fig. 7.34
Signal
X
1
(
A ¼
1): PSDs
SIGNA
L
X2: A=1,f
2
=250 Hz
0.2
0.15
0.1
0.05
0
0
100
200
300
400
500
f
SIGNAL X2: A=1,f2=250 Hz
10
0
10
-5
10
-10
0
100
200
300
400
500
f
Fig. 7.35
Signal
X
2
(
A ¼
1): PSDs
Exercise M.7.3
(MATLAB file
exercise_M_7_3.m
) Using the periodogram
method, estimate the PSDs and show the PSD plots for normal white signals with:
1.
m ¼
4 and
s
2
¼
9.
2.
m ¼
5 and
s
2
¼
16.


Search WWH ::

Custom Search