Biomedical Engineering Reference
In-Depth Information
Note that the histogram counts in column #3 need to be normalized by
the number of genes in each group. Option '-n 6' sets the number of
decimals to 6 and '-b 100' the number of histogram bins to 100.
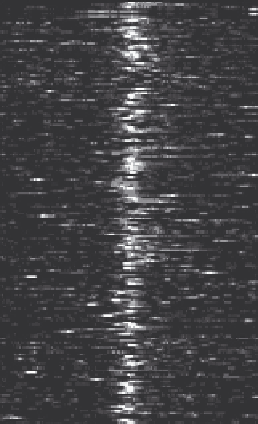
8.5.2 Creating ChIP-seq read density heatmaps
Although average ChIP-seq profi les are useful for easy visualization and
validation, they do not reveal the exact binding site position per gene.
This can be achieved by ChIP-seq read density heatmaps around TSSs
(Figure 8.6). To produce the data for this type of plot, the user can simply
utilize the vectors operations '-merge' and '-bins', so that now the
histograms are produced per gene rather than for the entire offset fi le.
$ cat offset.high.txt | sort | vectors -merge | vectors -bins -b 200 -m
10 > heatmap.high.txt
$ cat offset.high.txt | sort | vectors -merge | vectors -bins -b 200 -m
10 > heatmap.high.txt
$ head heatmap.high.txt
ENSMUSG00000090025:ENSMUST00000160944
$ head heatmap.high.txt
ENSMUSG00000090025:ENSMUST00000160944
0 0 4 0 4 0 4 0 0 0 0 . . .
0 0 4 0 4 0 4 0 0 0 0 . . .
ENSMUSG00000064842:ENSMUST00000082908
ENSMUSG00000064842:ENSMUST00000082908
0 0 0 0 0 0 0 0 0 0 0 . . .
0 0 0 0 0 0 0 0 0 0 0 . . .
ENSMUSG00000051951:ENSMUST00000159265
ENSMUSG00000051951:ENSMUST00000159265
0 0 0 0 0 0 0 0 4 0 4 . . .
0 0 0 0 0 0 0 0 4 0 4 . . .
. . .
...
Figure 8.6
Example of TSS read heatmap for select genes


Search WWH ::

Custom Search