Database Reference
In-Depth Information
1
0.8
0.6
Pseudopotential radii sums
Electronegativity
0.4
0.2
0
-0.2
-0.4
Valency
3
Cohesive energy
2
Ionization energy
-0.2
0
0.2
0.4
0.6
0.8
Loadings on PC2 (21.85%)
1
A15
AIB
2
Cupric Oxide
Mo
5
PbS
8
NaCl
Pr
2
Rh
2
Sn
13
CrFe
C15
AuCu
3
AsNi
Co
4
S
5
Si
10
Miscellaneous
0
Other discriminant
methods can be applied
to identify the spatial
feature of MgB
2
-1
MgB
2
-2
-3
-6
-4
-2
0
2
PC2
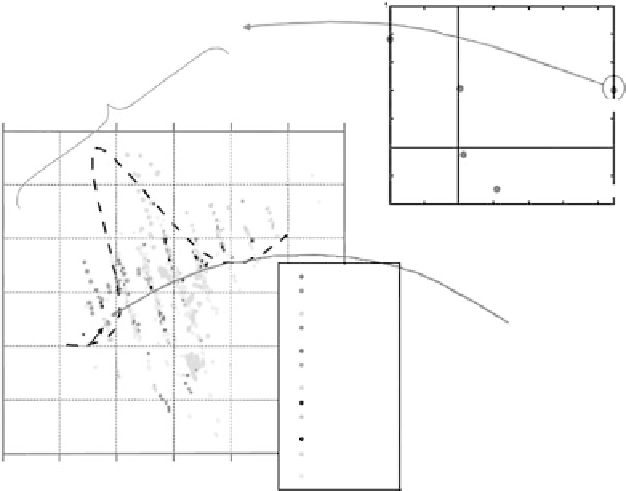
Figure 8.6
(See color insert following page 224.) Interpreting results by
comparing the scoring plot on the left and the loading plot on the right. The
dashed curve shows the trend in transition temperature across the linear clus-
ters. The peak corresponds to those with the highest recorded temperatures.
By comparison to the earlier scoring plot, and using a different visualization
scheme, we can now capture a more complete perspective of trends in this
multivariate dataset.
this case do not have a discrete physical meaning, other directions in the PC
projections can. We will later show examples of how the PC axes can correlate
directly to trends in a physical parameter. It is also interesting to note that
the more recent discovery of MgB2 as a high-temperature superconductor
actually shows up in this plot, indicating how this multidimensional analysis
appears to capture the critical physics governing high-Tc materials, where Tc
is the transition temperature of the superconductor.
Up to this point, we have been examining the scoring plot looking at how
the compound chemistries correlate to each other. Let us now examine the
loading plot of the variables used in the calculation to examine how they corre-
late with each other in terms of their influence on superconducting transition
temperature.
The loading plot in the top right corner of Figure 8.6 suggests that the
attribute
cohesive energy
does not play a major role in discriminating among
compounds in terms of the linear clustering projection, as it is near the origin